
This article is also available in: 繁體中文 · 日本語 · 한국어 · Bahasa Indonesia · Bahasa Melayu · ไทย · Português (Brasil) · Español · Türkçe · Tiếng Việt · Deutsch · हिन्दी
Contents (32)
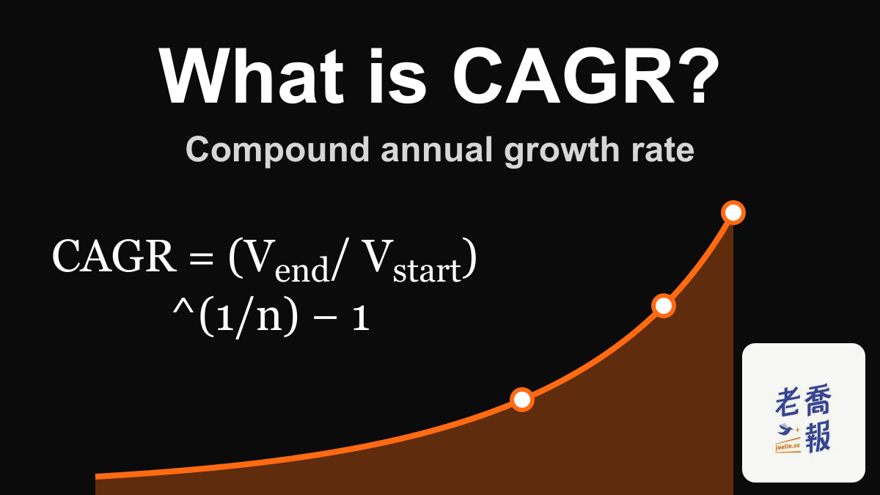
CAGR (compound annual growth rate) means the average speed at which a sum of money grows each year, assuming you invest once and never add or withdraw along the way. It flattens bumpy returns into one annualized number you can compare across assets.
| Item | One-line answer |
|---|---|
| Also called | Compound annual growth rate (in investing, often simply called the “annualized return”) |
| Pronunciation | Spelled out C-A-G-R, also commonly said “KAY-ger” |
| Formula | CAGR = (end value ÷ start value)^(1 ÷ years) − 1 |
| Example | 1 million → 2.5 million after 10 years → CAGR of about 9.6% |
| Not for | Money added or withdrawn along the way, or regular investing (use XIRR instead) |
That table is the quick-reference version of this whole article. Below, in order: how to read the formula, how to calculate it in Excel, the common mistakes, and how it differs from the year-over-year growth rate, IRR, XIRR and TWR.
Whenever people discuss investment performance, you will have seen a figure like this:
Annualized return: X%
In most cases, “annualized” here means CAGR. Many people use CAGR, XIRR and IRR interchangeably, but in professional investing and financial analysis, CAGR has a very clear and very simple role.
What question does CAGR actually answer?
CAGR is an average annualized growth rate that assumes you did nothing at all from start to finish.
It answers only one question:
If I put in a sum of money at the start, never added to it or withdrew from it, and it grew into today’s number, how much did it grow on average each year?
That is why CAGR is often described as the compound annual growth rate or the long-run average annualized return.
How do you say CAGR, and what else is it called?
CAGR is usually spelled out letter by letter, C-A-G-R. You will also often hear it said as one word, “KAY-ger”; both are understood.
The names you will run into:
- Compound annual growth rate (the full, most precise name)
- Annualized return (used almost as a synonym in an investing context)
Whether a report says CAGR, compound annual growth rate or annualized return, it means the same thing.
How to read the CAGR formula: three numbers are all you need
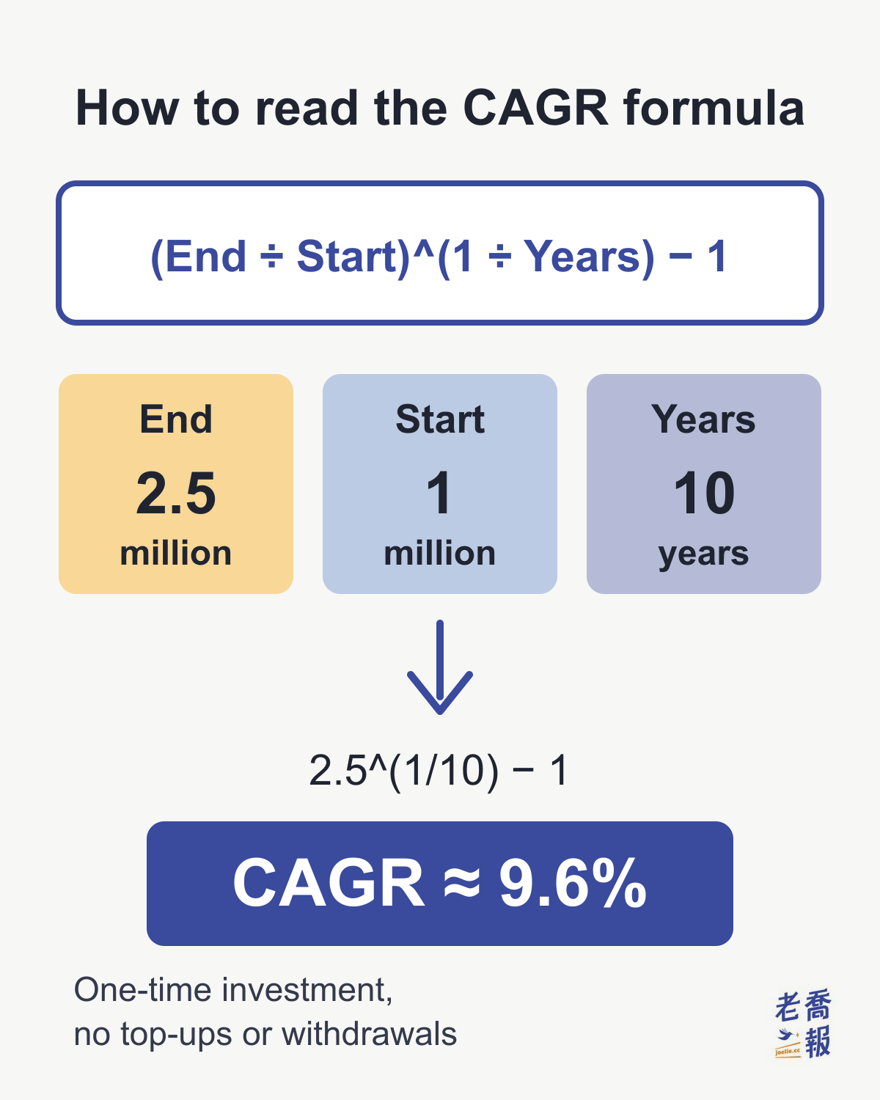
The CAGR formula has only three variables: the end value, the start value and the number of years.
| What you plug in |
This example |
What it means |
|---|---|---|
| Start | 1 million | The money you put in at the beginning |
| End | 2.5 million | What it grew into |
| Years | 10 years | How many years passed from investing to measuring |
| End ÷ Start | 2.5 | How many times bigger it got in total |
| Take the “Years”-th root | About 1.096 | 2.5^(1/10) |
| Subtract 1 | About 9.6% | This is the CAGR |
Just work down the table step by step: first find how many times bigger the money got, then take the root matching the number of years, and finally subtract 1.
Here is a worked example:
- At the start of 2016 you put NT$1 million into 0050 (Yuanta Taiwan 50 ETF, Taiwan’s largest index ETF, tracking the 50 largest listed companies). These are illustrative numbers that are easy to work out by hand, not 0050’s actual performance.
- By the end of 2025, that money has become NT$2.5 million
- You never added to it or withdrew from it
CAGR = (250 / 100)^(1/10) − 1 = 9.6%
In other words, it is as if the investment grew a steady 9.6% every year for those 10 years. In reality 0050 might rise 30% one year and fall 15% the next, but CAGR flattens that into one number you can compare across assets.
CAGR deliberately ignores all of the following:
- Money added along the way
- Money withdrawn along the way
- When cash dividends were paid
- Whether you got itchy fingers and traded in and out
This is not a flaw. It is the design.
How to calculate CAGR in Excel or Google Sheets, step by step
Taking roots by hand is a chore; in a spreadsheet it takes one line. The steps below are the same in Excel and Google Sheets.
Step 1: Put the three numbers into cells
| Cell | A | B | C |
|---|---|---|---|
| Row 1 (headers) | Start | End | Years |
| Row 2 (numbers) | 1000000 | 2500000 | 10 |
Type only numbers in the cells. You can enter 1000000 or 1,000,000, but not text such as “1 million” or “$1M”: the spreadsheet treats that as text and cannot calculate with it. For the years, count how many years actually passed: from the start of 2016 to the end of 2025 is 10 years, not 2025 − 2016 = 9.
Step 2: Type a formula in D2 (pick one of three)
- Write out the formula
Type in D2:=(B2/A2)^(1/C2)-1
Watch out for: “^” is Shift+6 on a US keyboard; 1/C2 must be in parentheses - Built-in RRI function
Type in D2:=RRI(C2,A2,B2)
Watch out for: The order is years, start, end, so years comes first - Built-in RATE function
Type in D2:=RATE(C2,0,-A2,B2)
Watch out for: Put a minus sign in front of the start value; the second argument is always 0
All three give about 9.6%, so pick whichever you can remember. Joe finds RRI the most intuitive: drop in the three numbers and you have the answer, as long as you remember that years goes first.
Step 3: Press Enter, then switch the result to a percentage
After you press Enter, D2 may first show a decimal such as 0.0959…. That is not a mistake; it just has not been turned into a percentage yet (if it already shows a percentage, skip this step):
- Select D2.
- In Excel, click the “%” (Percent Style) button on the Home tab. In Google Sheets, click “%” (Format as percent) on the toolbar.
- Adjust the decimal places. In Excel, clicking “%” shows 10%; click “Increase Decimal” once and it becomes 9.6%. In Google Sheets, clicking “%” shows 9.60% straight away; to keep just one decimal place, click “Decrease decimal places” once.
Positive or negative? The three formulas follow different rules
This is where most people get stuck: CAGR, RATE and XIRR all calculate returns, yet they expect different signs.
=(B2/A2)^(1/C2)-1
Start value: Positive
End value: Positive
If you get it wrong: A negative number gives a wrong result or an error code=RRI(years,start,end)
Start value: Positive
End value: Positive
If you get it wrong: A negative number, or a start value or years of 0: #NUM!=RATE(years,0,-start,end)
Start value: Negative
End value: Positive
If you get it wrong: Forgot the minus sign on the start value: #NUM!=XIRR(amounts,dates)
Start value: Each amount put in is negative
End value: The final market value is positive
If you get it wrong: All amounts with the same sign: #NUM!
The logic behind the rules fits in one sentence: CAGR and RRI only ask “how many times bigger did it get”, so both amounts are positive, while RATE and XIRR are cash-flow calculations, where money paid out is negative and money coming back is positive. If you added or withdrew money along the way and need XIRR, see the XIRR article for how to record each amount.
Can’t get a result? Common errors and fixes
| What you see |
Usually because |
How to fix it |
|---|---|---|
| #NUM! | A negative number in RRI, or years or the start value is 0; or no minus sign on the start value in RATE | Re-enter following the sign rules in the previous section |
| #DIV/0! | With the written-out formula, the start value or years is 0 or blank | Fill in the start value and years |
| #VALUE! | An amount typed as text, such as “1 million” | Change it to a plain number: 1000000 |
| A decimal such as 0.0959… | Not yet formatted as a percentage | Click “%” on the toolbar |
| A strange number such as −75% | Written as ^1/C2, missing the parentheses |
Change it to ^(1/C2) |
| The result is a bit higher than expected | One year too few (for example, counting the start of 2016 to the end of 2025 as 9 years) | Recount how many years passed |
The last row is the easiest to overlook: with one year too few, the same 1 million growing to 2.5 million shows a CAGR of about 10.7% instead of 9.6%. The performance looks better, but the calculation is wrong.
What if it is not a whole number of years?
If the period is not a whole number of years (for example, 2023-03-15 to 2026-10-27), skip the years in C2. Put the start date in D2 and the end date in E2, then type the formula below in F2, which replaces the years with “days ÷ 365”:
=(B2/A2)^(365/(E2-D2))-1
Enter the dates in a date format the spreadsheet recognizes (for example, 2023-03-15); subtracting one date from the other gives the number of days.
Working backwards: from CAGR to a future value
CAGR also works in reverse, to answer “at this pace, how much will it become?”:
- End value = start value × (1 + CAGR)^years. Example: 1 million growing at 9.6% for 10 years is 1 million × (1.096)^10 ≈ 2.5 million.
- How long to double: use the rule of 72 for mental math, 72 ÷ 9.6 ≈ 7.5 years (about 7.56 years if calculated precisely).
Keep in mind that this only extends the past average pace forward; it does not guarantee future returns.
Wait: CAGR is not the yearly returns added up and divided by the number of years
This is the most common misunderstanding about CAGR, and it comes down to the difference between two kinds of average. In plain terms:
- Simple average (arithmetic mean): add up the numbers and divide by how many there are. It is like averaging exam scores: each exam counts on its own and does not affect the others.
- Geometric average: each result rolls into the next, so this year’s starting amount is last year’s result, and you average by multiplying. This is the kind CAGR uses.
Why must investing use the geometric average? An everyday example makes it clear:
Your monthly salary is 50,000. This year you get a 10% raise, and next year a 10% pay cut.
After the raise it is 55,000; the cut takes 10% off 55,000, leaving 49,500.
Up 10% and down 10% has a simple average of 0%, as if you were back where you started, yet you actually have 500 less than at the beginning. The 10% cut came off the 55,000 you had after the raise. Investing works the same way: each year’s gain or loss is applied to the previous year’s result.
Scale that up to investing with an example that defies intuition. Suppose a sum of money goes:
- Year 1: +50%, from 1 million to 1.5 million
- Year 2: −50%, from 1.5 million to 750,000
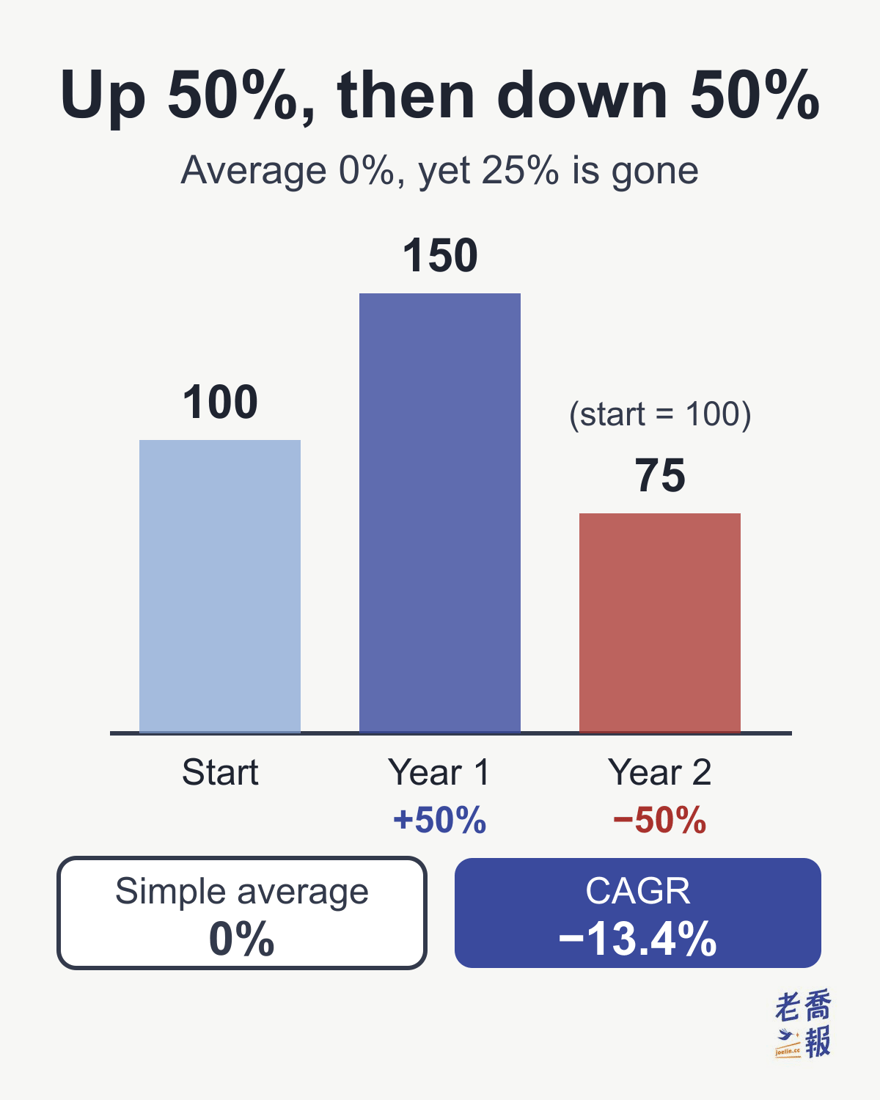
The chart shows the same path as an index starting at 100. Here is what the two kinds of average make of the same pair of moves:
flowchart TD
    A["Two years: +50%, −50%"] --> B["Simple average<br/>(+50% − 50%) ÷ 2"]
    A --> C["Geometric (CAGR)<br/>100 → 150 → 75"]
    B --> D["0%<br/>Looks like break-even"]
    C --> E["−13.4% a year<br/>25% actually gone"]
On the simple average, (+50% − 50%) ÷ 2 = 0%, as if you neither gained nor lost. But you actually have only 750,000 left: a 25% loss. CAGR tells the real story:
CAGR = (75 ÷ 100)^(1 ÷ 2) − 1 = −13.4%
Here is how to decide which average to use:
| What you want to measure |
Which average |
Examples |
|---|---|---|
| Each instance stands alone and does not accumulate | Simple average | Monthly electricity bills, exam scores, daily step counts |
| Each result rolls into the next period | Geometric average (CAGR) | Investment returns, revenue growth, pay changes, price inflation |
There is only one test: is this period’s starting point the previous period’s result? If yes, use the geometric average. That is why any long-term performance figure must use CAGR, not yearly returns added up and divided by the number of years. Once gains and losses alternate, the simple average always overstates your real growth rate, and the bigger the swings, the bigger the overstatement.
Not just investing: CAGR for revenue and sales
Many people looking up a “growth rate formula” actually want the growth of a company’s revenue, sales or market size. The formula is exactly the same; you just swap the money amounts for revenue.
Suppose a company’s revenue changes over 5 years like this:
| Year | Revenue | Year-over-year growth |
|---|---|---|
| 2020 | 50 million | — |
| 2021 | 60 million | +20.0% |
| 2022 | 54 million | −10.0% |
| 2023 | 65 million | +20.4% |
| 2024 | 72 million | +10.8% |
| 2025 | 80 million | +11.1% |
The simple average of the five yearly growth rates is 10.45%, but CAGR gives (80 ÷ 50)^(1 ÷ 5) − 1 ≈ 9.86%. The gap of about 0.6 percentage points is the overstatement the simple average picks up from the uneven years, and the decline in the middle year makes it more visible (the numbers are illustrative).
So keep the two terms apart:
- Year-over-year (YoY) growth rate: this year versus last year, a single year only.
- CAGR: the average yearly growth speed over several years, which shows the long-term trend.
When an annual report or industry report says “revenue CAGR of 9.9% over the past five years”, it means the second one.
Why does the industry love CAGR?
Because CAGR is the easiest measure to standardize for comparison.
In practice, CAGR shows up most often in:
- Official long-term ETF performance
- Index backtests (S&P 500, 0050, VTI)
- Multi-year growth of company revenue and industry market size
- Long-run comparisons across markets and eras
- “If you had bought in a given year and held until now” scenarios
The point is not whether you actually did this. The point is who performed better under the same assumption.
How to use CAGR correctly
CAGR is best for three kinds of comparison:
- Against a market index
- Against other products of the same type
- Against yourself over different periods (long-term trends)
It is not suited to answering:
- How much I personally made
- Whether my own trading decisions were right
Those questions were never CAGR’s job.
An important fact that is often overlooked
CAGR is essentially a result under ideal conditions.
It assumes that you:
- Invested in one lump sum
- Had no emotions at all
- Needed no cash along the way
- Made no mistakes
In reality, most people’s actual returns come in below the CAGR for the same period.
That does not mean you are bad at this. CAGR was simply never meant to describe real life.
When should you not use CAGR?
CAGR is the wrong tool when:
- You invest a fixed amount on a regular schedule (dollar-cost averaging)
- You added or withdrew money along the way
- Cash moves in and out of the account frequently
- You want to evaluate your own investing behavior
In those cases, use XIRR or TWR instead of forcing CAGR to fit.
CAGR vs YoY growth vs IRR / XIRR / TWR: how they differ
- CAGR (Compound annual growth rate)
Handles cash flows? ❌ No
Best for: Long-term performance of a product, index or revenue - YoY (Year-over-year growth rate)
Handles cash flows? ❌ No
Best for: The change in a single year - IRR (Internal rate of return)
Handles cash flows? ✅ Yes (fixed intervals)
Best for: Returns at the project level - XIRR (Extended (irregular) internal rate of return)
Handles cash flows? ✅ Yes (any dates)
Best for: Your own real-world investing performance
Joe’s guide: XIRR formula explained for beginners - TWR (Time-weighted return)
Handles cash flows? ✅ Removes the effect of cash flows
Best for: Judging a portfolio manager’s skill
Joe’s guide: What is TWR, and why don’t professionals use XIRR?
An easy way to remember it:
CAGR compares the product; XIRR compares you; TWR compares the manager.
If you want to evaluate how much your own investing actually earned over the past few years, read the XIRR article. If you want to know why professional institutions use TWR rather than XIRR, read the TWR article.
Don’t want to calculate by hand? Use a calculator
The four measures are calculated differently, and it is easy to slip when applying the formulas by hand. For plain CAGR, the one-line Excel formula above is the fastest. Joe also built two online tools; their interface is currently in Traditional Chinese only, but dates and numbers work as usual. If you buy a fixed amount on a regular schedule and want to work back to an annualized return, use the DCA compound calculator. If money moves in and out at irregular times (a lump sum, later top-ups or withdrawals), use the XIRR calculator: paste in the dates and amounts and it calculates your personal annualized return directly, with no formula to set up.
How good is your CAGR?
Once you have your CAGR, the next question is always “Is that high or low?” Start with a few long-term reference points (all with dividends included, long-run approximations):
| Benchmark | Long-term annualized (CAGR) |
|---|---|
| US market (S&P 500) | About 10% |
| Taiwan’s 0050 | About 8–9% |
| Warren Buffett (Berkshire Hathaway) | 19.7% |
The Buffett row is the annualized return on Berkshire Hathaway’s market value per share over his 61 years as CEO (1965–2025); the S&P 500 with dividends returned 10.5% over the same period (official 2025 annual report). That is a world-class level almost no one has beaten over the long run, but over the past 10 and 20 years Berkshire has performed roughly in line with the market, and its excess return came mainly from the early years.
To compare your own number, you can read it roughly like this:
| Your long-term CAGR | What it means |
|---|---|
| 8–10% | Sustain it over the long run and you are already keeping pace with the market |
| 15% or more (year after year) | You are one of very few top performers |
| 30% or 50% | Don’t be envious just yet; first ask “from which year to which year?” |
Be especially careful with the last row: pick the right start and end points and the CAGR of the very same asset can look very different, so always read someone’s number together with its period.
To see what the very best long-term returns look like, read Warren Buffett’s annualized return vs the S&P 500 (it includes a year-by-year table from 1965).
What about that “8–9%” for 0050 if you did what most people actually do, investing a fixed amount every month instead of a lump sum? On a sister site Joe ran the numbers month by month over 22 years: Yuanta Taiwan 50 (0050) monthly investing over 22 years: NT$5.4 million in becomes NT$33.82 million, 14% annualized (Chinese original). It also shows how far the “annualized return” of the same fund can differ depending on the method (CAGR versus an internal rate of return that includes cash flows).
CAGR in practice: which funds really beat 10% over the long run?
With the theory done, here are real cases:
ETFs with a CAGR above 10% over the past 20 years (Chinese original)
That article uses CAGR to rank long-running US, Taiwan and cross-market ETFs in one table, and shows that very few ETFs have truly held above 10% over the long run.
Want to understand the main types of Taiwan ETFs first, and how their long-term annualized returns differ?
Frequently asked questions (FAQ)
What does CAGR mean?
CAGR stands for compound annual growth rate. It means how much a sum of money grows on average each year, assuming you invest once and never add or withdraw along the way. It flattens bumpy returns into one annualized number you can compare across products and across eras.
Is CAGR the same as annualized return?
In an investing context, usually yes. The full name is compound annual growth rate, and when people quote an annualized return for an investment, they most often mean its CAGR. It is the same concept under different names.
How do you pronounce CAGR?
It is often spelled out letter by letter, C-A-G-R, and it is also commonly said as one word, KAY-ger. Both are understood.
How do you calculate CAGR?
CAGR = (end value ÷ start value)^(1 ÷ years) − 1. For example, 1 million growing to 2.5 million over 10 years: 2.5 million ÷ 1 million = 2.5, its 10th root is about 1.096, and subtracting 1 gives a CAGR of about 9.6%.
How do you calculate CAGR in Excel or Google Sheets?
Put the start value in A2, the end value in B2 and the number of years in C2, type =(B2/A2)^(1/C2)-1 in D2, press Enter and format the cell as a percentage. You can also use the built-in function =RRI(C2,A2,B2) (the order is years, start, end). Enter both amounts as positive numbers; if you use RATE instead, the start value must be negative: =RATE(C2,0,-A2,B2).
Should amounts be positive or negative when calculating CAGR?
With the CAGR formula or the RRI function, enter both the start and end values as positive numbers. Negative numbers give a wrong result or an error (RRI shows #NUM!). Only the RATE function needs a minus sign on the start value. When you use XIRR for returns with several cash flows, money you put in is negative and the final market value is positive.
What is the difference between the simple (arithmetic) average and the geometric average?
The simple average adds up the numbers and divides by how many there are; it suits things where each instance stands on its own, such as exam scores. The geometric average accounts for each period’s result rolling into the next, so investment returns, revenue growth and pay changes all need it. For example, up 50% then down 50% has a simple average of 0%, but 1 million is actually left as 750,000, and the geometric average (CAGR) is −13.4% a year.
How is CAGR different from the year-over-year growth rate?
The year-over-year (YoY) growth rate is the change in a single year, this year versus last year. CAGR is the average yearly growth speed over several years. Averaging the yearly growth rates (a simple average) usually overstates growth; CAGR uses the geometric average, so it matches the actual speed from the start point to the end point.
What is a good CAGR?
As long-run approximations with dividends included, the US S&P 500 returns about 10% and Taiwan’s 0050 about 8–9%. In Warren Buffett’s 61 years as CEO (1965–2025), Berkshire Hathaway’s market value per share compounded at 19.7% a year, which is a world-class level. Sustaining 8–10% over the long run keeps pace with the market; when you see 30% or 50% annualized, first ask from which year to which year it was measured.
Wrap-up: where CAGR belongs
You can think of CAGR as:
“If everything goes perfectly, how does this investment product itself perform?”
It is not the answer to your life, but it is the common language of every investment comparison.
Once you understand its place, you will stop misreading investment performance figures.
Joe’s “Taiwan Wealth Report” series collects his notes on wealth: series index (Chinese original).
This is a personal research note, not investment advice.
Keywords: CAGR meaning, CAGR formula, compound annual growth rate, how to calculate CAGR, CAGR in Excel
Sources: Chinese original first published 2026-01-04; revised 2026-10-27. Benchmark returns are long-run approximations with dividends included; the 0050 example uses illustrative numbers for a Taiwan ETF.
This English version is based on original Traditional Chinese content on joelin.cc. The language and explanations are localised for international readers. The Traditional Chinese original is the authoritative version — for its complete meaning, please read the original article.