
This article is also available in: 繁體中文 · 日本語 · 한국어 · Bahasa Indonesia · Bahasa Melayu · ไทย · Português (Brasil) · Español · Türkçe · Tiếng Việt · Deutsch · हिन्दी
Contents (30)
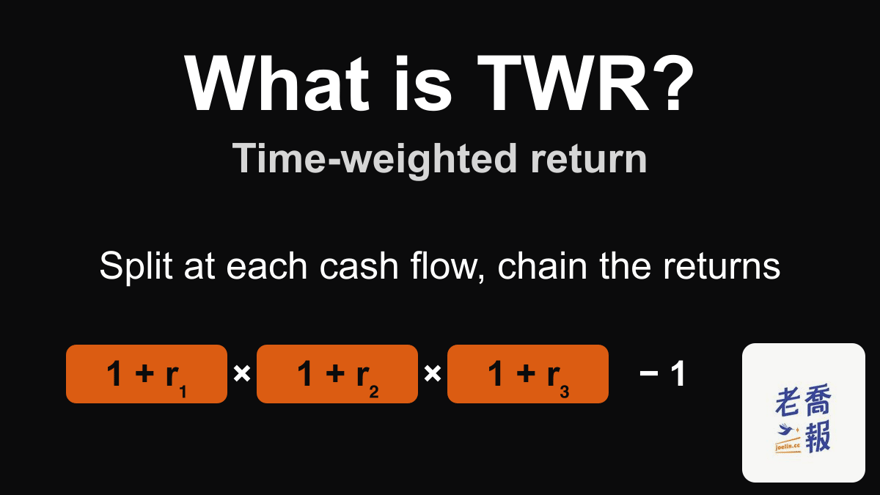
TWR (time-weighted return) means this: split the investment period into segments at every point where money moves in or out, calculate the return of each segment, then chain those returns together by multiplying. The resulting figure is not affected by when investors add or withdraw money, which is why funds and advisers use it to judge a manager’s performance.
| Item | Short answer |
|---|---|
| Also called | Time-weighted rate of return, TWRR |
| Formula | TWR = (1 + r₁) × (1 + r₂) × … × (1 + rₙ) − 1 |
| Example | +10% in the first half, +15% in the second → TWR 26.5% |
| What it compares | The manager or strategy itself, regardless of when you moved money |
| Not for | Finding out how much you yourself made (use XIRR instead) |
That table is the quick version of the whole article. Below, in order: why TWR is calculated this way, the formula step by step, two investors in the same fund, how to do it in Excel, and how it compares with XIRR, CAGR and IRR.
When you start digging into investment performance, you will run into something counterintuitive:
Why do funds and investment advisers hardly ever mention XIRR when they talk about performance, and use a measure called TWR instead?
It is not because XIRR is bad. TWR and XIRR simply answer different questions.
What question does TWR answer?
TWR is a performance measure that deliberately excludes investor behavior.
It wants to answer only one question:
Ignoring when money moved in and out of the account, how well did the investment strategy or the manager itself perform?
A note on names:
- TWR = time-weighted return, the most common English name
- TWR, TWRR and time-weighted rate of return all mean the same thing
- Its counterpart is the money-weighted return (MWR), which is the family XIRR belongs to
Why exclude investor behavior?
Because the professional world draws an important line between:
- Product or strategy performance
- The investor’s actual experience
If what you are evaluating is:
- A fund manager
- An adviser’s strategy
- A quantitative model
- Trading skill
then you should not be distracted by things like:
- When investors added money
- Investors rushing in only after a big rally
- Panic redemptions during a fall
Those are about people, not about the strategy.
The TWR formula and how to calculate it
The logic of TWR fits in one sentence:
Treat each period on its own, then chain the returns of those periods together.
As a formula:
TWR = (1 + r₁) × (1 + r₂) × … × (1 + rₙ) − 1
r₁, r₂ and so on are the returns of each period. In practice there are four steps:
- Every time money moves in or out of the account, start a new segment on that day.
- Each segment’s return = end value ÷ (start value + money added that day) − 1. For a withdrawal, the amount added is a negative number.
- Multiply the (1 + return) of every segment together and subtract 1. That is the TWR for the whole period.
- If the period is longer than a year and you want to compare it with someone else’s annual return, annualize it: (1 + TWR)^(365 ÷ days) − 1. For periods shorter than a year, the fund industry’s performance standard (GIPS) does not allow annualizing, because annualizing a short-term return easily inflates it.
There is only one purpose: to make sure that when the money arrived, and how much of it, does not affect how the strategy is judged.
Worked example: one top-up in the middle of the year
Many people get stuck on TWR because they never find an example that actually shows the numbers. Here is the simplest version.
Suppose an account had three events over the past year:
- Jan 1: you invest 1,000,000, and by Jun 30 it has grown to 1,100,000 (a return of +10% for this period)
- Jun 30: you add another 500,000, and the account balance becomes 1,600,000
- Dec 31: the account is worth 1,840,000 (a return of +15% for the second half)
The TWR calculation:
- Return of segment 1 = 1,100,000 / 1,000,000 − 1 = +10%
- Return of segment 2 = 1,840,000 / (1,100,000 + 500,000) − 1 = +15%
- TWR = (1 + 10%) × (1 + 15%) − 1 = +26.5%
flowchart TD
    A["Jan 1: invest 1,000,000"] --> B["Jun 30: grows to 1,100,000<br/>Segment 1: +10%"]
    B --> C["Jun 30: add 500,000<br/>Balance 1,600,000"]
    C --> D["Dec 31: balance 1,840,000<br/>Segment 2: +15%"]
    D --> E["TWR = 1.10 × 1.15 − 1<br/>= 26.5%"]
Chain the two segment returns of +10% and +15% by multiplying and subtract 1, and the TWR is 26.5%. The 500,000 added in the middle has no effect on this number at all.
If you calculate the same account with XIRR (cash flows −1,000,000, −500,000, +1,840,000), you get about 27.6%, close to the TWR. That is because the top-up was not large and the market kept rising after it, so the two halves performed similarly.
So when do TWR and XIRR differ a lot? That is the next example.
Same fund, two investors: same TWR, very different XIRR
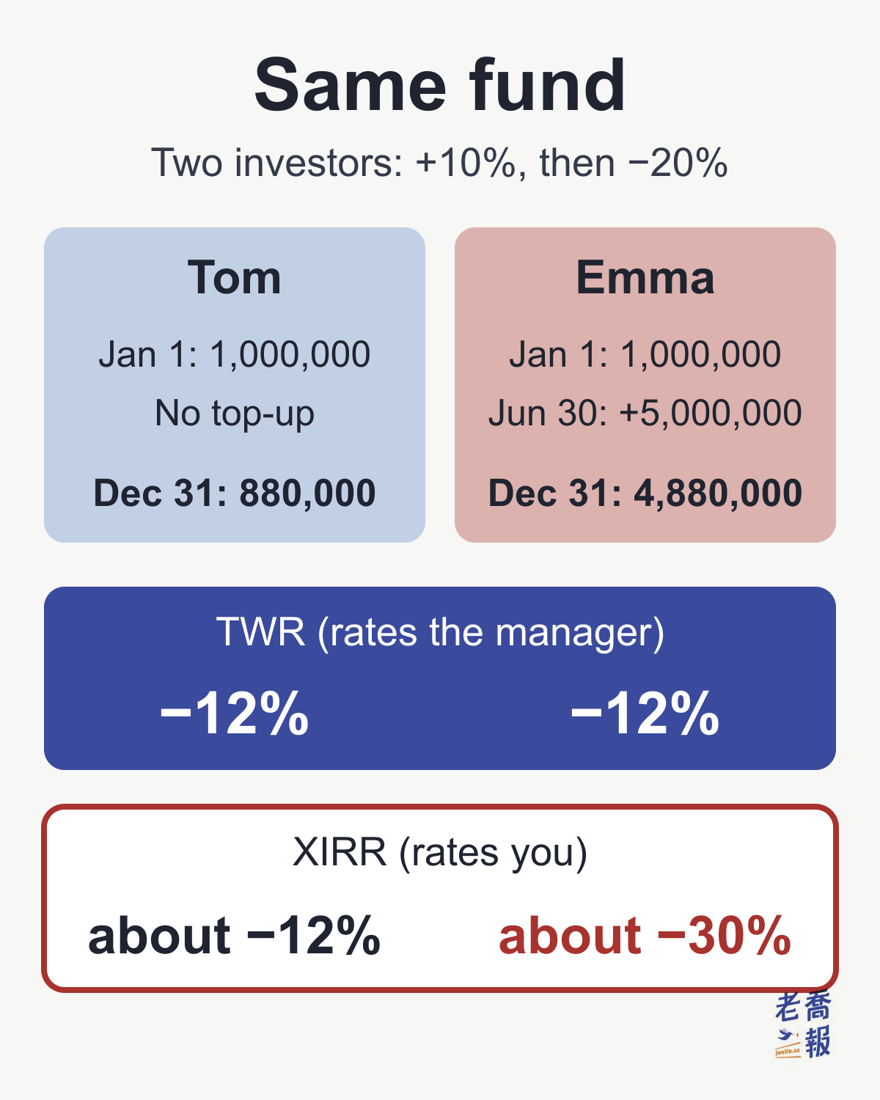
Suppose a fund returns +10% in the first half of the year and −20% in the second half. Tom and Emma each invest 1,000,000 on Jan 1:
| Item | Tom | Emma |
|---|---|---|
| Jan 1 invest | 1,000,000 | 1,000,000 |
| Jun 30 top-up | No top-up | 5,000,000 |
| Dec 31 account | 880,000 | 4,880,000 |
| TWR | −12% | −12% |
| XIRR | about −12% | about −30% |
Both bought the same fund, so both have a TWR of 1.10 × 0.80 − 1 = −12%. That is the manager’s result for the year. Emma added a large sum after the first-half rally, just in time for the −20% second half: 6,000,000 invested became 4,880,000, and her XIRR fell to about −30%. The extra loss comes from the timing of her own top-up, not from the manager.
So:
XIRR asks “how much did you make?”; TWR asks “how well did the strategy do?”
How to calculate TWR in Excel or Google Sheets
Neither Excel nor Google Sheets has a built-in TWR function, so you calculate each segment yourself and then chain them. Using the “one top-up in the middle of the year” example above, it takes three steps.
Step 1: put the data in three columns
Column A holds the date, column B the account value that day (before any deposit or withdrawal), and column C the money added that day, with withdrawals as negative numbers:
| A Date | B Value | C Added |
|---|---|---|
| 2026-01-01 | 0 | 1,000,000 |
| 2026-06-30 | 1,100,000 | 500,000 |
| 2026-12-31 | 1,840,000 | 0 |
The first row is the day the account was opened: the balance was 0 and you put in 1,000,000. The last row is the valuation date; with no money in or out, enter 0. The date column has to be in a real date format, or the annualizing step later cannot count the days.
Step 2: calculate each segment’s return
In D3, enter:
=B3/(B2+C2)-1Then fill down to D4. D3 shows 10% and D4 shows 15%. In words: this segment’s end value ÷ (the previous end value + the money added that day) − 1.
Step 3: chain them by multiplying
In E3, enter =1+D3 and fill down to E4, then in any cell enter:
=PRODUCT(E3:E4)-1The result is 0.265; click the “%” button to show it as a percentage, 26.5%. This “extra column, then PRODUCT” approach works in both Excel and Google Sheets.
If you want it in a single cell in Excel, you can also use:
=EXP(SUMPRODUCT(LN(1+D3:D4)))-1To annualize a period longer than a year (assuming the TWR is in F1):
=(1+F1)^(365/(A4-A2))-1In the example, Jan 1 to Dec 31 is 364 days, so the annualized figure is about 26.6%, almost the same as 26.5%; the further the period is from one year, the bigger the gap. Do not force an annualized figure for a period clearly shorter than a year. The fund industry’s performance standard (GIPS) also says returns for periods under a year must not be annualized.
Common mistakes
| What was entered | Result |
|---|---|
| Forgot the top-up in the denominator: =B4/B3-1 | 67.3% (the 500,000 top-up counted as profit) |
| Added the segment returns: 10% + 15% | 25% (no compounding) |
| End value ÷ total invested: 1,840,000 ÷ 1,500,000 − 1 | 22.7% (a simple return, not TWR) |
| A 300,000 withdrawal entered as positive | Segment 2 −34.3%, TWR −27.7% (should be +26.5%) |
The first two are the most common: if the denominator leaves out the money added that day, the money you deposited yourself is counted as something the manager earned. The last row assumes that on Jun 30 you withdrew 300,000 instead and the account was 920,000 at year end; the correct entry for the withdrawal is −300,000.
Note also that the signs are the opposite of XIRR: in this TWR table, money added is positive. XIRR looks at things from your pocket, so money invested is negative. For details, see XIRR formula explained for beginners.
TWR, XIRR (MWR), CAGR or IRR: which one to use?
First, one term you will often see in English sources: MWR (money-weighted return). It looks at how much your money actually made or lost, so periods when more money was invested count for more; in practice it is calculated with IRR or XIRR. TWR is the opposite: every period has the same weight, no matter how much money was in the account.
| Measure | The question it answers |
|---|---|
| TWR | How well did the manager or strategy itself do? |
| XIRR (MWR) | How much did I personally make? |
| CAGR | If one lump sum stays put, how much does it grow per year on average? |
| IRR | Is an investment with cash flows at fixed intervals worth it? |
The four measures answer four different questions. Pick the wrong one and, however accurate the number, it answers a different question.
| Measure | Timing? | Used in |
|---|---|---|
| TWR | Deliberately excluded | Fund reports, adviser presentations |
| XIRR | Included; exact dates matter | Personal accounts |
| CAGR | Assumes no money in or out | Market indexes, single products |
| IRR | Included, but needs equal intervals | Projects, real estate |
Whether the timing of cash flows counts is exactly where TWR and XIRR part ways; CAGR simply assumes there are no cash flows at all.
One line to remember the role of each:
CAGR rates the product; XIRR rates you; TWR rates the manager.
Further reading:
- CAGR meaning: formula, worked example and how to say it
- XIRR formula explained for beginners, with 5 worked examples
How does the industry use TWR in practice?
In financial practice:
- TWR = the manager’s performance
- XIRR = the investor’s performance
That is why you see:
- Fund annual reports using TWR
- Adviser presentations using TWR
- Hedge funds and private funds mostly using TWR in their disclosures too
Because the question they need to answer is:
“If you had followed this strategy exactly, how would it have done?”
and not:
“How much did one particular investor make, given when they happened to get in?”
The exception is private equity and venture capital, where the manager decides when to call capital from investors. There, the timing of cash flows is itself the manager’s decision, so the industry uses IRR to evaluate these funds instead.
Warren Buffett’s long-term record can be compared directly with the market (over his 61 years as CEO, 1965–2025, Berkshire’s per-share market value grew 19.7% a year versus 10.5% for the S&P 500 with dividends, according to the official 2025 annual report) because the comparison uses Berkshire’s per-share market value, which is not affected by when individual investors moved money in or out. For comparisons over different periods, see Warren Buffett’s annualized return vs the S&P 500, which includes a year-by-year table from 1965.
Why not XIRR?
You can use it, but it would not be fair.
XIRR is extremely sensitive to when and how much money goes in:
- Adding a large sum just before a big rally → XIRR looks great
- Adding a large sum just before a big fall → XIRR looks terrible (like Emma above)
Those numbers reflect the investor’s timing, not the manager’s skill. Judging a manager by XIRR means charging the clients’ timing to the manager.
In professional evaluation, that is unacceptable.
Who is TWR for, and who is it not for?
It suits
- Evaluating funds, strategies and models
- Comparing different ways of managing money
- Judging whether a long-term strategy is consistent
It does not suit
- Managing a personal account
- People with real-life cash needs
- Anyone who wants to know how much they actually made
If your goal is to find out how much your investments really earned over the years, read the detailed explanation of XIRR. That is the tool you should be using.
A common misunderstanding
Many people look at TWR and ask:
So what does this number have to do with me?
The answer: it is related to you, but it does not describe your life.
It tells you whether the tool is good, not whether you used it well.
Quick summary (for people in a hurry)
- TWR = time-weighted return = the industry standard for comparing managers
- Method: split at each cash flow, multiply each segment’s (1 + return), then subtract 1
- Excel: segment return =B3/(B2+C2)-1, then chain with PRODUCT
- TWR does not care when you added money, only how the strategy itself performed
- See TWR → a strategy is being compared
- See XIRR → an individual investor is being compared
- See CAGR → a lump-sum product held to the end is being compared
Frequently asked questions
What does TWR mean?
TWR stands for time-weighted return. It is the standard measure the finance industry uses to judge the performance of a strategy or manager itself, and it deliberately removes the effect of when investors add or withdraw money.
How do you calculate time-weighted return?
Split the investment period into segments at every cash flow in or out. Each segment’s return = end value ÷ (start value + money added that day) − 1. Then multiply the (1 + return) of every segment together and subtract 1. Example: segment 1 is +10% and segment 2 is +15%, so TWR = (1.10 × 1.15) − 1 = 26.5%.
How do you calculate TWR in Excel?
Neither Excel nor Google Sheets has a built-in TWR function. Put the date, the account value that day (before any deposit or withdrawal) and the money added that day (withdrawals as negative numbers) in three columns. Get each segment’s return with =B3/(B2+C2)-1 and fill down, add a column with =1+D3, then chain them with =PRODUCT(E3:E4)-1. For periods longer than a year, convert to an annual figure with =(1+TWR)^(365/days)-1; under the industry performance standard, periods shorter than a year are not annualized.
What is the difference between TWR and XIRR?
TWR evaluates the strategy itself; XIRR evaluates what the investor actually got. Take one fund that returns +10% in the first half of the year and −20% in the second. An investor who never adds money and one who adds 5,000,000 on June 30 both have a TWR of −12%, but their XIRR is about −12% and about −30%, because XIRR counts when and how much money you put in, and TWR does not.
What is the difference between TWR and MWR?
MWR (money-weighted return) looks at how much your money actually made or lost, so periods when more money was invested count for more; in practice it is calculated with IRR or XIRR. TWR gives every period the same weight no matter how much money was in the account. The first compares investors, the second compares managers.
Why do fund reports use TWR rather than CAGR?
Funds have ongoing inflows, outflows and distributions, so the CAGR assumption of one lump sum held to the end does not hold. TWR splits the period at each cash flow, which is what makes it a fair way to judge the manager’s skill.
Should individual investors calculate TWR?
Usually not. Most people want to know how much they actually made, and that is the job of XIRR. You would only use TWR to look at the strategy itself, for example to compare your own stock-picking skill against a fund or the market.
Are TWRR and time-weighted rate of return the same as TWR?
Yes. Time-weighted return (TWR), time-weighted rate of return and the abbreviation TWRR all describe the same method. The most common form is simply time-weighted return, or TWR.
Related terms
The concepts you are most likely to want next after this article:
| Term | In one line |
|---|---|
| Compound annual growth rate (CAGR) | Long-run annual growth, assuming one lump sum held to the end |
| XIRR (internal rate of return) | Takes the timing of cash flows into account |
| Buffett’s long-term annual return | A real-world reference case for TWR and CAGR |
| Taiwan Wealth Map (Chinese) | Index of Joe’s personal-finance series |
These four pages can be read together with this one: first separate the three kinds of return, then look at a real case.
Wrap-up: where TWR belongs
Here is an easy way to remember it:
When the question is “is the strategy any good?”, use TWR. When the question is “how much did I make?”, use XIRR.
Mixing up these two questions is the root of most investors’ long-term misjudgments.
Joe’s Taiwan Wealth Report series
Joe collects what he has seen and learned about wealth in a series called “Joe’s Taiwan Wealth Map”. It is not meant to hand out answers, but to help people see where they stand.
The “Taiwan Wealth Report” series index is here (Chinese)
Keywords: TWR, TWR meaning, what is TWR, time-weighted return, time-weighted return formula, how to calculate TWR, TWR Excel, TWR vs XIRR, MWR
Sources: Chinese original first published 2026-01-04; revised 2026-10-27. The worked examples are illustrative; the Chinese naming note has been replaced with English usage.
This English version is based on original Traditional Chinese content on joelin.cc. The language and explanations are localised for international readers. The Traditional Chinese original is the authoritative version — for its complete meaning, please read the original article.