
This article is also available in: 繁體中文 · 日本語 · 한국어 · Bahasa Indonesia · Bahasa Melayu · ไทย · Português (Brasil) · Español · Türkçe · Tiếng Việt · Deutsch
Contents (14)
In one line: Australia runs two systems, one measures marbling, the other predicts whether you’ll enjoy it
In Chinese-language coverage, Australian beef comes down to almost one thing: the MB score. But Australia is actually running two completely different things at once:
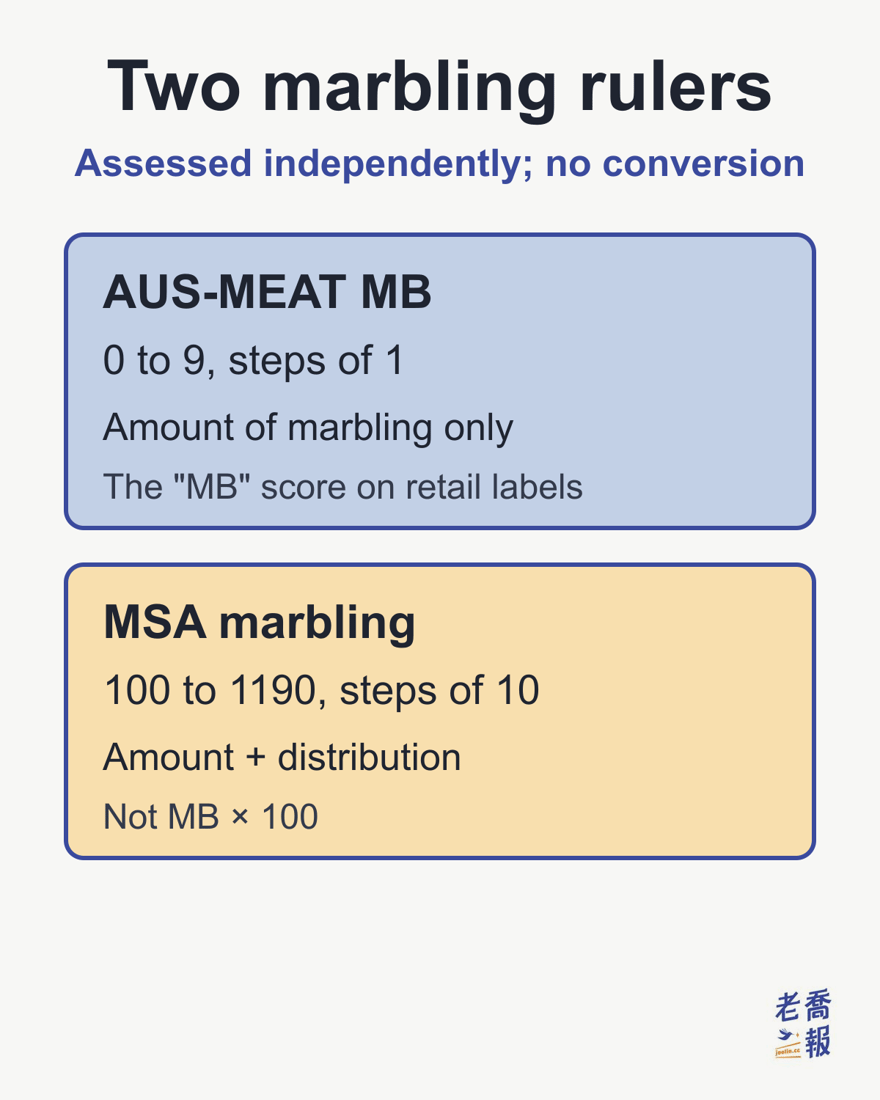
- The AUS-MEAT marbling score, 0 to 9, which measures the amount of marbling on the ribeye cross-section.
- MSA (Meat Standards Australia), a prediction system trained on real consumer taste-test scores. Its output is “this cut, cooked this way, will eat at so many stars”.
The first follows the same logic as the US and Japan: measure the carcass’s physical traits and let the buyer infer the eating experience. The second is one of the few standards in the world that bets directly on how the beef will eat, and its answer changes with the cut and the cooking method.
This is the Australian installment of who sets beef grading standards.
1. AUS-MEAT and MSA marbling scores are not one ruler at two resolutions
| AUS-MEAT marbling |
MSA marbling |
|
|---|---|---|
| Range | 0 (none) to 9 (extreme) | 100 (none) to 1190 (extreme) |
| Increment | 1 | 10 |
| Measures | Amount of marbling | Amount and distribution |
Meat & Livestock Australia’s official explanation is clear: the two scores are assessed independently, because their assessment criteria are different.
Many people assume MSA is just AUS-MEAT times 100, a scale ten times finer. It isn’t. MSA adds a dimension, distribution: the same amount of marbling spread evenly versus concentrated in one area means something different for eating quality, and the two rulers will reach different conclusions. So when you see “MB9” and “MSA 800” side by side, don’t try to check one against the other.
When retailers talk about “Wagyu M9” or “Marble Score 9+”, they mean the AUS-MEAT system.
2. Where MSA came from: it grew out of consumers’ mouths
This is the most fundamental difference between MSA and every other beef standard. USDA’s thresholds and JMGA’s grade bands are, at heart, specifications set by experts looking at carcasses. MSA works the other way around: first have large numbers of ordinary consumers taste and score the beef, then go back and find which carcass traits predict those scores.
The scale deserves its own note. Meat & Livestock Australia’s sensory research report states that beef taste testing has involved more than 86,000 consumers scoring 603,000 beef samples. A larger number on MLA’s website, close to 1.7 million taste tests from more than 250,000 consumers in 13 countries, is cumulative for the whole MSA system, beef and sheepmeat together, and cannot all be counted as beef tastings.
And the testers are untrained everyday consumers, not professional panelists. That choice is deliberate: the system is meant to predict whether ordinary people will be satisfied, not whether experts think the beef is good.
Consumers score four things: tenderness, juiciness, flavor and overall liking. The combination of these four is MSA’s eating quality score.
3. What goes into the model
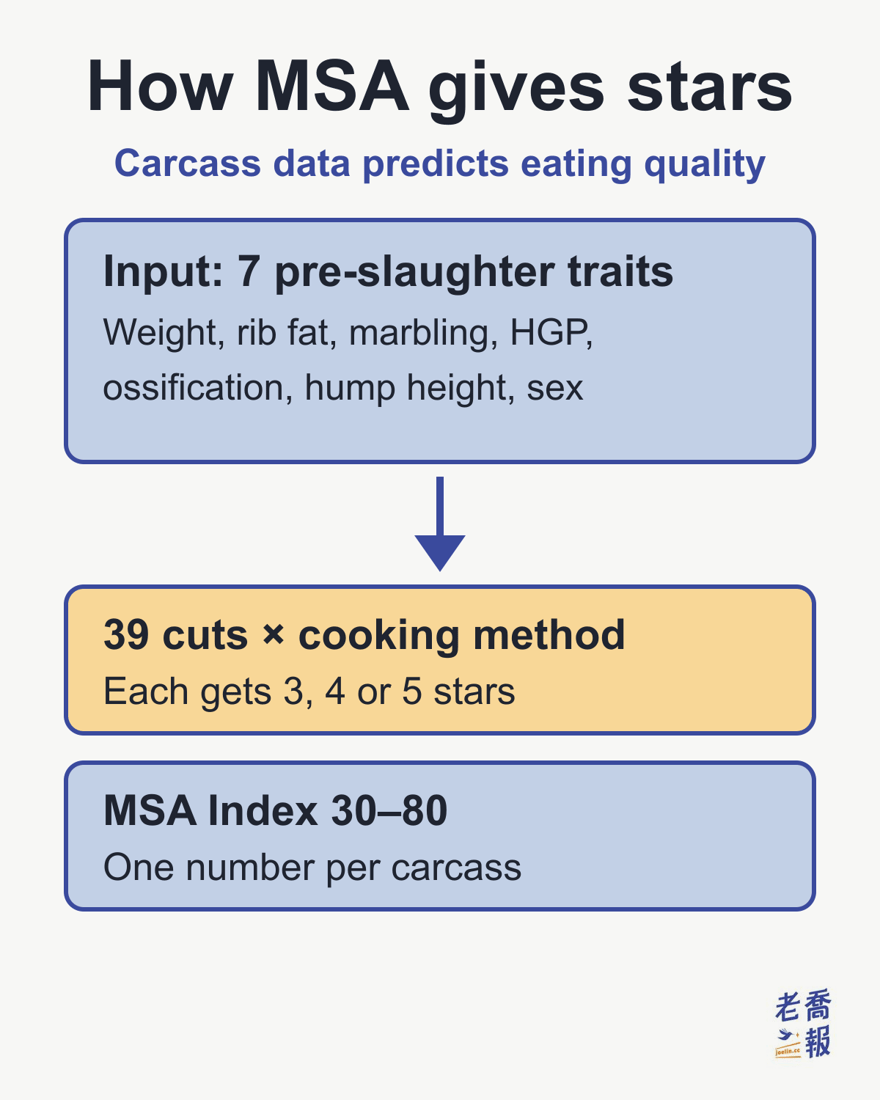
The MSA model uses carcass traits that are fixed before slaughter:
- Carcass weight
- Rib fat thickness
- Marbling score
- Ossification score (reflects physiological maturity)
- Whether hormonal growth promotants (HGP) were used
- Hump height (reflects the proportion of Bos indicus content)
- Sex
The variables that processors can control, such as carcass hanging method, aging days, pH and loin temperature, are standardized when calculating the MSA Index rather than treated as floating inputs.
It is a smart split: separating decisions made on the farm from decisions made at the plant is what lets the same number be compared across plants and over time.
4. Output one: 39 cuts, each with its own star rating
The MSA model predicts the eating quality of 39 cuts in a carcass, covering the cooking methods suited to each cut and aging periods from 5 to 50 days. The output has three levels:
| Rating | Meaning |
|---|---|
| MSA 3 star | Good everyday |
| MSA 4 star | Better than everyday |
| MSA 5 star | Premium |
What matters most in this table is not the three levels but what they are attached to: stars attach to a cut × cooking method combination, not to the whole animal. One cut from the same carcass can be 5 stars grilled and 3 stars slow-cooked, or cut A can be 5 stars and cut B 3 stars, and both are normal results.
Other standards give you a grade and leave you to guess how to cook it; MSA tells you directly which cooking method gets this piece of beef to how many stars. It is the most consumer-friendly design, and also the hardest one for the production side to deliver.
5. Output two: the MSA Index, a number you can compare across plants
The MSA Index is a weighted average of the scores of those 39 cuts, each under its most common cooking method, giving one number for the eating quality potential of the whole carcass.
- It ranges from 30 to 80 and is reported to two decimal places (for example, 54.62).
- Because it is calculated only from pre-slaughter traits and excludes processing variables, it can be compared across plants and over time.
For producers, the value of this number is that it is a clean mirror. Send the same cattle to different plants and process them with different aging times, and the quality that reaches the plate will differ, but the MSA Index is not contaminated by those differences. It reflects only how well the breeding and feeding were done.
6. This design answers a question other standards don’t
Put the four major standards side by side and you find Australia is asking a different question.
The US, Japanese and Chinese standards all answer: what are the physical traits of this carcass? How those traits relate to eating quality is left to accumulated market experience.
MSA answers: this piece of beef, cooked this way, will an ordinary person be satisfied?
That question comes at a cost. It needs continuous consumer taste testing to maintain the model, every cut, every cooking method and every aging period has to be tested, and the model is updated as new data comes in. It is far more expensive and far more complex than writing a specification.
But it also pushes the role of a standard one step further: not just describing a product, but making a prediction for consumers and standing behind that prediction. If you want to judge whether a standard is good, that is a more fundamental question than whether its grade bands are fine enough.
7. Practical notes, using Taiwan as an example
This article was first written for readers in Taiwan, where Australian beef on the shelf is most often labeled with an MB score (the AUS-MEAT system). When you see one, keep in mind:
- An MB score only speaks to the amount of marbling. It says nothing about distribution and does not predict eating quality.
- MSA-certified products carry the MSA logo and recommended cooking methods on the pack. That is a separate set of information; the two can appear together but are not interchangeable.
- Claims like “MB2 and above is equivalent to US Choice” are retail analogies. There is no official equivalence between AUS-MEAT and USDA.
Sources
- Meat & Livestock Australia (MLA), Solutions to Feedback: the ranges, increments and independent assessment of AUS-MEAT marbling and MSA marbling; the definition of the MSA Index, its 30 to 80 range and the list of model inputs
- MLA, Meat Standards Australia Tips & Tools series: 39 cuts, what 3 to 5 stars mean, and the 5 to 50 day aging range
- Public statements by MLA and Australian industry bodies on the scale of MSA consumer testing: beef sensory research covering 86,000 consumers and 603,000 beef samples (MLA 2017 sensory research report); MSA as a whole (beef and sheepmeat) at about 1.7 million tests, 250,000 consumers and 13 countries (MLA website MSA page)
Keywords: Australian beef grading, MSA, Meat Standards Australia, AUS-MEAT, marble score, MSA Index, Wagyu M9
Frequently asked questions
Is an Australian MB score the same thing as MSA?
No. MB refers to the AUS-MEAT marbling score, which runs from 0 to 9 and measures only the amount of marbling. MSA is a separate system: its marbling score runs from 100 to 1190 and looks at both the amount and the distribution of marbling, and MSA as a whole predicts eating quality rather than describing the carcass. Australia’s official explanation states that the two scores are assessed independently, so when you see MB9 and MSA 800 side by side, don’t try to convert one into the other.
Where do MSA star ratings come from?
They are predicted by a model. MSA ran large-scale taste tests with untrained, everyday consumers, who scored beef for tenderness, juiciness, flavor and overall liking; researchers then worked out which pre-slaughter carcass traits predict those scores. For beef, the tests cover more than 86,000 consumers and 603,000 samples; including sheepmeat, MSA as a whole has run close to 1.7 million tests with more than 250,000 consumers in 13 countries. The model outputs 3, 4 or 5 stars for 39 cuts, each with its suitable cooking methods and aging periods of 5 to 50 days.
Why do different cuts from the same animal get different star ratings?
Because that is the reality. MSA stars are attached to a cut × cooking method combination, not to the whole animal. So a cut from one carcass might be 5 stars grilled and 3 stars slow-cooked, or cut A might rate higher than cut B, and both are normal results. Other standards give one overall grade and leave you to guess how to cook it; MSA spells out the pairing, which is the most consumer-friendly part of its design.
What is the MSA Index? Is higher better?
The MSA Index is a weighted average of the scores of 39 cuts under each cut’s most common cooking method, giving a single number for the eating quality potential of the whole carcass. It runs from 30 to 80 and is reported to two decimal places. A higher number means better overall potential. What makes it special is that it is calculated only from pre-slaughter traits and excludes processing variables, so it can be compared across plants and over time, letting producers see the results of their genetics and management without plant-to-plant differences getting in the way.
Sources: Chinese original first published 2026-09-16; its information was revised 2026-10-27, including a correction to the scale of consumer testing: the 1.7 million tests are cumulative for MSA beef and sheepmeat combined, while beef sensory research covers 86,000 consumers and 603,000 beef samples (MLA's 2017 sensory research report). Scales, the MSA Index range and the model inputs follow Meat & Livestock Australia's published explanations.
This English version is based on original Traditional Chinese content on joelin.cc. The language and explanations are localised for international readers. The Traditional Chinese original is the authoritative version — for its complete meaning, please read the original article.