
This article is also available in: 繁體中文 · 日本語
Contents (12)
On the November 17, 2026 close, the five listed companies that make trading cards ranked by market capitalization (market cap) as follows: Nintendo about ¥11.5 trillion, Bandai Namco about ¥4.5 trillion, Konami Group (Konami) about ¥4.2 trillion, TOMY Company (Takara Tomy) about ¥505.3 billion, and Bushiroad about ¥61.0 billion. Only Bushiroad breaks out its card revenue: cards were 46.4% of revenue (fiscal year ended June 2026), the highest share of the five. Its market cap is 12.8 times last year’s operating profit, the lowest multiple of the five, and its size, margins, and IP ownership differ from the other four (see below). The other four have cards mixed into larger segments: the segments that include cards are about 75% of revenue at Konami and about 50% at Bandai Namco, Takara Tomy does not break cards out, and Nintendo’s revenue does not include Pokémon cards at all. This site’s reading is that the market prices the whole company, not the cards.
This is one article in the Japan trading card industry series, the last one in Part 1 (upstream, male-oriented and all-ages). The earlier articles each take apart one company’s books; this one puts the five side by side to see how much cards account for in revenue and what price the market puts on each company. It only compares public figures. It does not discuss whether share prices will rise or fall, and it is not a recommendation to buy or sell anything.



How market cap is calculated: closing price times shares issued
Market cap = the closing price on a given day × shares issued. This article uses the Tokyo Stock Exchange closing prices of November 17, 2026, multiplied by the period-end shares issued (including treasury shares) stated in each company’s latest earnings summary. Takara Tomy’s earnings summary also computes its market capitalization as closing price times period-end shares issued.
Closing prices are in yen and shares issued are in millions of shares.
| Company | Close | Shares |
|---|---|---|
| Nintendo | 8,926 | 1,287 |
| Bandai Namco | 7,034 | 645 |
| Konami | 29,530 | 143.5 |
| Takara Tomy | 5,398 | 93.6 |
| Bushiroad | 443 | 137.8 |
Share counts come from the earnings summaries as of the end of September 2026 (the interim period for the four companies with March fiscal year-ends, the first quarter for Bushiroad). Bushiroad did a two-for-one stock split on October 1, 2025. Counting treasury shares makes market cap higher than a calculation that excludes them; Nintendo’s treasury shares are about 10% of its total, so it differs the most. All five use the same basis. This site’s Japan market cap ranking (in Chinese) uses a different basis, so its numbers differ.
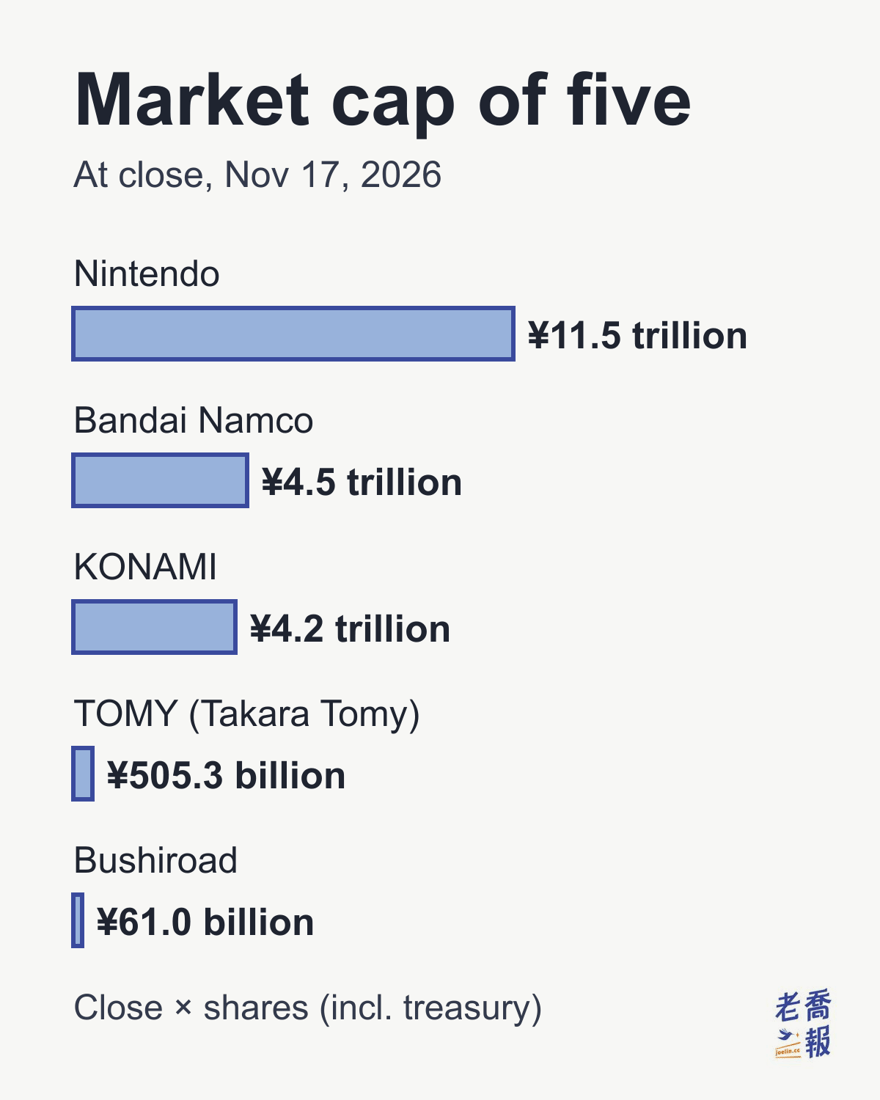
Market cap changes every day. On a different closing day, the numbers and multiples for all five would differ; this article takes a single reference date for comparison.
How much of revenue is cards: only one company breaks it out
Periods: Bushiroad is the fiscal year ended June 2026; the others are the fiscal year ended March 2026.
| Company | Card share | Basis |
|---|---|---|
| Bushiroad | 46.4% | TCG revenue |
| Konami | Not disclosed | Segment 75% |
| Bandai Namco | Not disclosed | Segment 50% |
| Takara Tomy | Not disclosed | By region |
| Nintendo | Excluded | Equity method |
Only Bushiroad publishes card revenue (¥26.850 billion ÷ revenue of ¥57.823 billion). At Konami, cards sit in the Digital Entertainment segment (¥371.0 billion, 75% of revenue of ¥493.7 billion). At Bandai Namco, cards sit in the Toys and Hobby Unit (¥673.97 billion, 50% of ¥1,348.2 billion). Both segments also include games or toys, and segment revenue includes transactions between segments.
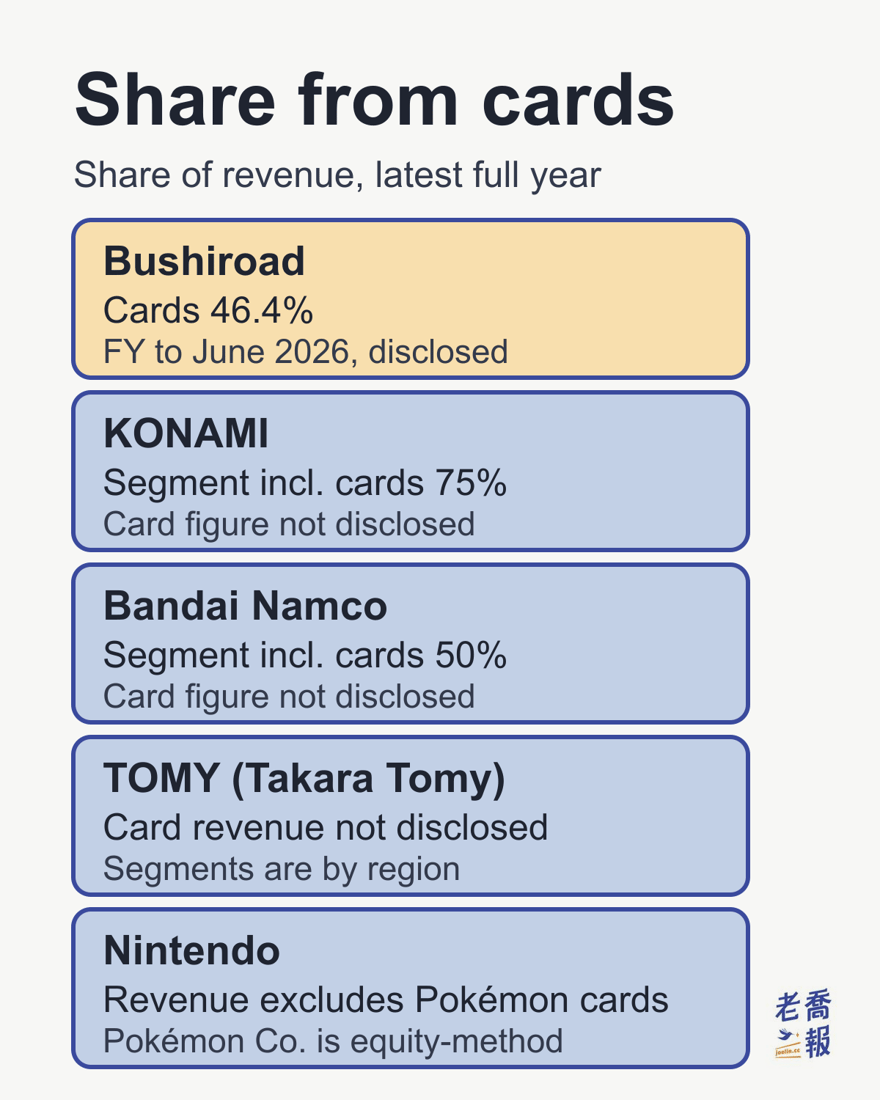
The Pokémon Company, which is behind Pokémon cards, is not listed. Nintendo holds 32% of its voting rights, and Nintendo’s annual securities report lists it as an equity-method affiliate. So Pokémon card revenue does not go into Nintendo’s revenue; it is booked only in proportion to Nintendo’s stake, in equity in earnings of affiliates. For the fiscal year ended March 2026 that line was ¥82.792 billion, a total that includes The Pokémon Company and other affiliates and is not broken out. For The Pokémon Company’s own books, see The Pokémon Company’s ¥120.1 billion in annual net profit.
The price the market gives: market cap as a multiple of operating profit
Units are yen. Operating profit is for the latest fiscal year (Bushiroad’s fiscal year ended June 2026, the others’ fiscal year ended March 2026). Multiple (×) = market cap (Cap) ÷ operating profit, sorted from high to low. This multiple simply puts market cap next to last year’s profit: it contains no forecasts, does not subtract cash or debt, and is not a valuation model. Nintendo’s operating profit excludes equity in earnings of affiliates of ¥82.792 billion (which includes The Pokémon Company); adding it back brings the multiple to about 25.9.
| Company | Cap | Op. profit | × |
|---|---|---|---|
| Nintendo | ¥11.49tn | ¥360.1bn | 31.9 |
| Konami | ¥4.24tn | ¥135.9bn | 31.2 |
| Bandai Namco | ¥4.54tn | ¥189.5bn | 23.9 |
| Takara Tomy | ¥505.3bn | ¥24.2bn | 20.8 |
| Bushiroad | ¥61.0bn | ¥4.75bn | 12.8 |
Bushiroad, with the highest card share, has the lowest multiple. Nintendo, with the highest multiple, has no cards in its revenue, and with equity in earnings of affiliates added back it ranks behind Konami. Change the denominator and the ranking changes. Operating margins also differ a lot across the five: Konami 27.5%, Nintendo 15.6%, Bandai Namco 14.1%, Takara Tomy 9.0%, Bushiroad 8.2%.
Why card share and market cap do not line up
This is as far as the public data goes: no consistent relationship shows up between card share and market cap multiples. The reasons are not in the financial statements. What follows is this site’s view, not the companies’ or the market’s:
- Size: Bushiroad’s revenue is ¥57.8 billion, and the other four are about 5 to 40 times larger. The same news moves a small company’s profit more, and its numbers swing more.
- Margins: a high card share does not mean a high margin. Bushiroad’s operating margin is the lowest of the five, and its card profit is not disclosed.
- Who holds the IP: most of Bushiroad’s card IP belongs to others, so it pays license fees. Bandai Namco’s Gundam and Nintendo’s IP are in-house; but at Bandai, ONE PIECE and Dragon Ball are licensed, and Konami’s Yu-Gi-Oh! cards are based on a manga originally published by Shueisha (see Yu-Gi-Oh! and Duel Masters), while Konami’s own IP is in games. In-house IP can extend into games, anime, and merchandise, and the money earned stays inside the group.
- Timing: market cap reflects views about the future, while this comparison uses last year’s profit. On November 12, 2026, Bushiroad raised its full-year forecast to revenue of ¥71.0 billion and operating profit of ¥6.6 billion; on October 29, Konami raised its full-year forecast for the Digital Entertainment segment to business profit of ¥188.0 billion. Using forecasts, the multiples would be different.
So the answer to “how do card companies get their market cap” is this: the market looks at the whole company’s profit, IP, and growth, and cards are one piece of it. For now only Bushiroad, the company with the highest card share, breaks out card revenue, but that does not mean the market gives it a higher price.
Compared with peers: how much upstream card companies disclose
| Company | Card revenue | Card profit |
|---|---|---|
| Bushiroad | Disclosed | Not disclosed |
| Bandai Namco | Not disclosed | Not disclosed |
| Konami | Not disclosed | Not disclosed |
| Takara Tomy | Not disclosed | Not disclosed |
| Pokémon Co. | Not disclosed | Not disclosed |
None of the five listed companies, or the unlisted The Pokémon Company, discloses card profit. To see how cards affect market cap, you can only infer from segment figures and the companies’ written explanations, and those do not yield an exact share. Whenever the series hits this situation, it writes “not disclosed” and does not estimate.
Where to buy in Japan
Cards from these companies are sold at card specialty shops and toy retailers in Japan. To find a shop, you can use the Japan card shop directory run by Joe Lin (老喬): 16 chains and major independent shops (as of November 2026), searchable by chain or area.
Common questions
How is a card company’s market capitalization calculated?
Market cap equals closing price times shares issued. This article uses the Tokyo Stock Exchange closing prices of November 17, 2026, multiplied by the period-end shares issued (including treasury shares) in each company’s latest earnings summary (kessan tanshin). A different closing day gives different numbers.
Which card company gets the largest share of revenue from cards?
Among public figures, Bushiroad: TCG revenue was ¥26.850 billion in the fiscal year ended June 2026, 46.4% of company-wide revenue of ¥57.823 billion. Konami, Bandai Namco, and Takara Tomy do not break out card revenue.
Is Pokémon card revenue counted inside Nintendo?
No. Pokémon cards are published by The Pokémon Company. Nintendo holds 32% of its voting rights and treats it as an equity-method affiliate, so it only books its share through equity in earnings of affiliates. That line was ¥82.792 billion in the fiscal year ended March 2026, a total that includes The Pokémon Company and other affiliates and is not broken out.
Does a higher card share mean a higher market cap?
It does not look that way. At the November 17, 2026 close, Bushiroad, with the highest card share, had a market cap of 12.8 times operating profit, the lowest multiple of the five; Nintendo, whose revenue excludes cards, was at 31.9 times (about 25.9 times with equity in earnings of affiliates added back). Size, margins, and IP ownership differ across the companies. This article only compares public figures and is not investment advice.
Related reading
- Japan trading card industry series guide: the full list of articles, key figures from each, and how the numbers are defined
- The Pokémon Company’s ¥120.1 billion in annual net profit: the books of the unlisted The Pokémon Company
- How Bandai turns manga into cards: Bandai Namco’s revenue by IP and its Toys and Hobby Unit
- Bushiroad makes cards from other companies’ IP: the only company that breaks out card revenue
- How Yu-Gi-Oh! and Duel Masters keep going: which segment Konami and Takara Tomy put cards in
- Card-making is a specialty: rarity, reprints, lotteries, and ban lists
- Japan market cap ranking Top 50 (in Chinese): market cap ranking of large Japanese companies including Nintendo, updated weekly
Sources: Nintendo earnings summary for the fiscal year ended March 2026, second-quarter earnings summary for the fiscal year ending March 2027, 86th annual securities report; Bandai Namco Holdings earnings summary for the fiscal year ended March 2026, interim earnings summary for the fiscal year ending March 2027; Konami Group earnings summary for the fiscal year ended March 2026, second-quarter earnings summary for the fiscal year ending March 2027; TOMY Company earnings summary for the fiscal year ended March 2026, interim earnings summary for the fiscal year ending March 2027; Bushiroad earnings summary for the fiscal year ended June 2026, full-year earnings presentation for the fiscal year ended June 2026, first-quarter earnings summary for the fiscal year ending June 2027; closing prices from the Yahoo! Finance Japan time series for each stock (Tokyo Stock Exchange close, November 17, 2026). Checked on November 18, 2026. Logos come from each company’s official website and are used only to identify the companies; the two infographics and the hero image were created by this site. This article is industry research that only compares public figures. It is not investment advice of any kind, and it does not discuss buying or selling individual stocks, card prices, or resale.
Keywords: card company market cap, trading card market capitalization, Nintendo market cap, Bandai Namco market cap, Konami market cap, Bushiroad market cap, Takara Tomy market cap, card revenue share
Sources: The Chinese original was first published on 2026-11-18 (Taipei date). Market caps use closing prices on November 17, 2026 on the Tokyo Stock Exchange; financials are for the latest fiscal year (June 2026 for Bushiroad, March 2026 for the others). Covers listed companies in Japan.
This English version is based on original Traditional Chinese content on joelin.cc. The language and explanations are localised for international readers. The Traditional Chinese original is the authoritative version — for its complete meaning, please read the original article.