---
title: 'Warren Buffett''s annualized return: 19.7% vs 10.5% for the S&P 500, with 1–50 year windows and a 61-year table'
url: https://joelin.cc/en/p/6459
source: https://joelin.cc/en/p/6459
lang: en
pubDate: '2026-10-27'
date_modified: '2026-10-27'
description: 'Buffett as CEO, 1965–2025: Berkshire 19.7% a year vs 10.5% for the S&P 500, winning 40 of 61 years; over 10–20 years it matches or trails. Updated yearly.'
schema_type: BlogPosting
author: joe
entity_ids:
author: https://me.joelin.cc/#joe
ai_role: ai_only
translation_assistant: caddy
ai_credit: 'AI-assisted translation and editing: Caddy (AI)'
faq:
- q: What is Warren Buffett's annualized return?
a: Over Buffett's 61 years as CEO (1965–2025), Berkshire's official 2025 annual report puts the compounded annual gain in per-share market value at 19.7%, against 10.5% for the S&P 500 with dividends included. That era has ended, so these figures will not change. The "since 1965" figure, which will include 2026 and later years, and the 1- to 50-year windows are updated with every annual report; see the tables in this article.
- q: Has Warren Buffett retired? Who runs Berkshire now?
a: Buffett stepped down as CEO at the end of 2025, and Greg Abel has been President and CEO since January 1, 2026. Buffett initially stayed on as Chairman; on September 18, 2026 he became Chairman Emeritus and remains a director, and his son Howard G. Buffett succeeded him as Chairman of the Board (Berkshire press release).
- q: Did Berkshire beat the market every year?
a: No. In the 61 years Buffett was CEO, Berkshire beat the index in 40 and trailed in 21, a win rate of about 66%. In the ten full years 2015–2024 Berkshire returned 11.7% a year, behind the index's 13.1%, and it also trailed in 2025. Most of the long-run excess return came from 1975 to 1994.
- q: Can the two columns of the official table simply be subtracted?
a: Only with caution. The Berkshire column is the change in per-share market value; the S&P 500 column is a total return with dividends. Through 2018 the official table also noted that the S&P 500 figures were pre-tax while Berkshire's were after-tax. Year-by-year gaps show the trend, but they are not a precise measure of excess return.
- q: Why do some sources say Buffett returned more than 20% a year?
a: Usually because they copied the discontinued "per-share book value" column, or quoted an older edition (the 2024 annual report showed 19.9%). The book-value column was dropped from the official table starting in 2019. The 20.1% (1965–2023) in the earlier version of this article was also an outdated figure.
- q: How often are the figures in this article updated?
a: Once a year. Berkshire usually publishes its annual report on the last Saturday of February at 8 a.m. US Eastern time; a scheduled job then fetches the new PDF, re-parses it and updates the holding-period table, the year-by-year table and the era breakdown in this article.
translation_of: /p/6459
about:
- name: Warren Buffett
sameAs:
- https://www.wikidata.org/wiki/Q47213
mentions:
- name: Berkshire Hathaway
sameAs:
- https://www.wikidata.org/wiki/Q217583
- name: S&P 500
sameAs:
- https://www.wikidata.org/wiki/Q242345
- name: Greg Abel
sameAs:
- https://www.wikidata.org/wiki/Q47168572
---
# Warren Buffett's annualized return: 19.7% vs 10.5% for the S&P 500, with 1–50 year windows and a 61-year table
Over Warren Buffett's 61 years as CEO (1965–2025), Berkshire's per-share market value compounded at 19.7% a year and the S&P 500 with dividends at 10.5%, roughly 1.9 times the index.
Look at shorter windows and the picture changes: over the last 10 years (2016–2025) Berkshire returned 14.3% against 14.8% for the S&P 500, Berkshire behind by 0.5 percentage points; over the last 20 years (2006–2025) it was 11.3% against 11.0%, Berkshire ahead by 0.3 percentage points.
Greg Abel succeeded Buffett as CEO on January 1, 2026. The first full year of the Abel era will appear in Berkshire's February 2027 annual report.
Every figure here is calculated from the yearly data in Berkshire's official annual report and updates automatically when a new report is published (current data: 2025 annual report).
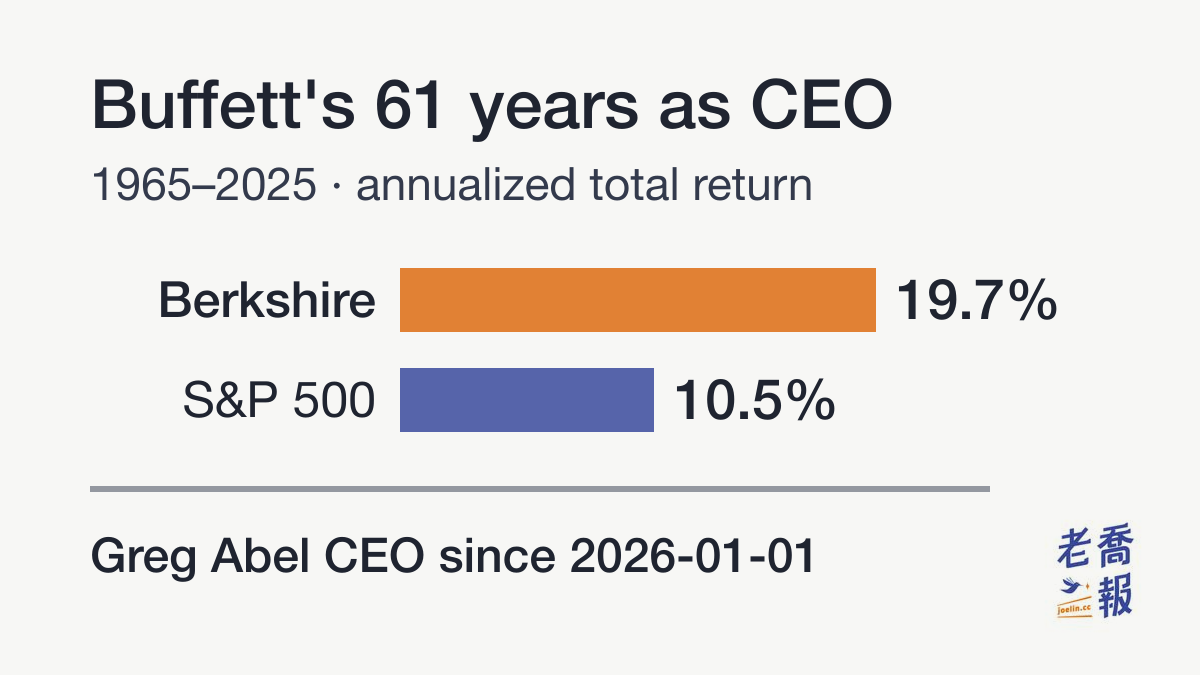
This article began as an estimate table Joe put together with an AI tool. In October 2026 it was rebuilt to read Berkshire Hathaway's official yearly table directly: the basis is the change in Berkshire's per-share market value, and the comparison is the S&P 500 total return with dividends from the same row of that table. Below you will find annualized returns over windows from 1 to 50 years, the split between the Buffett and Greg Abel eras, the full year-by-year table since 1965, and finally what 10,000 invested for 61 years would have become, plus Joe's own results.
## Berkshire vs the S&P 500: annualized returns by holding period
| Window | Berkshire | S&P 500 | Gap |
|---|---:|---:|---:|
| Last year
2025 | 10.9% | 17.9% | -7.0 |
| Last 3 years
2023–2025 | 17.2% | 23.0% | -5.8 |
| Last 5 years
2021–2025 | 16.8% | 14.4% | +2.4 |
| Last 10 years
2016–2025 | 14.3% | 14.8% | -0.5 |
| Last 20 years
2006–2025 | 11.3% | 11.0% | +0.3 |
| Last 30 years
1996–2025 | 11.1% | 10.4% | +0.7 |
| Last 50 years
1976–2025 | 21.7% | 12.0% | +9.7 |
| Since 1965 | 19.7% | 10.5% | +9.2 |
```mermaid
%%{init: {"xyChart": {"titleFontSize": 28, "xAxis": {"labelFontSize": 24, "labelPadding": 10}, "yAxis": {"labelFontSize": 24}}, "themeVariables": {"xyChart": {"plotColorPalette": "#e07b2a, #3a4a9d"}}}}%%
xychart-beta
title "Annualized (%)"
x-axis ["1", "3", "5", "10", "20", "30", "50", "61"]
y-axis 0 --> 25
line [10.9, 17.2, 16.8, 14.3, 11.3, 11.1, 21.7, 19.7]
line [17.9, 23.0, 14.4, 14.8, 11.0, 10.4, 12.0, 10.5]
```
Orange = Berkshire, dark blue = S&P 500 (with dividends); the horizontal axis counts years back from the latest report, with the same figures as the table above.
Windows where Berkshire led: 5 years, 20 years, 30 years, 50 years, since 1965. Windows where Berkshire trailed: 1 year, 3 years, 10 years.
Every window ends with the latest annual report (2025); the gap is in percentage points. "Since 1965" uses the officially published compounded figure; the other windows are compounded from the official yearly numbers (in the official table, 1965 and 1966 are fiscal years ending September 30 and 1967 covers 15 months).
Honestly, the numbers surprised Joe: over the last ten and twenty years Buffett's results are about the same as the index's, and over some windows Berkshire even trails.
The full history is a different story. Buffett did nearly twice as well as the market: at least 9 percentage points a year for 61 years, which compounds into a result on an entirely different scale (see the 10,000 example below).
## The end of the Buffett era: Greg Abel takes over in 2026
Buffett stepped down as CEO at the end of 2025, and Greg Abel took over on January 1, 2026. The official table starts in 1965, exactly the span of Buffett's leadership, so "Buffett's annualized return" is now a historical figure that will not change. Every year added from now on belongs to the Abel era.
Annualized returns split by CEO tenure (Berkshire = per-share market value; S&P 500 = with dividends included):
| Era | Berkshire | S&P 500 | Wins |
|---|---:|---:|:---:|
| Warren Buffett as CEO
1965–2025 (61 years) | 19.7% | 10.5% | 40/61 |
| Greg Abel as CEO
From 2026-01-01 | Pending | Pending | — |
The first full year of the Abel era will be reported in the February 2027 annual report. The Buffett-era figures are the 1965–2025 compounded annual gains published in Berkshire's 2025 annual report. Compounding the official yearly figures yourself gives 19.8% and 10.6%; the gap exists because the official yearly figures are rounded to one decimal place.
Greg Abel has been President and CEO since January 1, 2026 ([2025 shareholder letter](https://www.berkshirehathaway.com/letters/2025ltr.pdf)). Warren Buffett became Chairman Emeritus on 2026-09-18 and remains a director; Howard G. Buffett is now Chairman of the Board ([Berkshire press release](https://www.berkshirehathaway.com/news/sep1826.pdf), checked 2026-10-27).
## The full 61-year table and decade breakdown
> 📅 Data: 2025 annual report (updated automatically after Berkshire publishes it in late February) | Source: Berkshire Hathaway annual report, "Berkshire's Performance vs. the S&P 500" | Berkshire = change in per-share market value; S&P 500 = total return with dividends
| Period | Berkshire | S&P 500 |
|---|---:|---:|
| Compounded annual gain 1965–2025 | 19.7% | 10.5% |
| Overall gain 1964–2025 | 6,099,294% | 46,061% |
These are the official figures from the annual report. Broken down by decade, the annualized return was not earned evenly:
| Decade | Berkshire | S&P 500 | Wins |
|---|---:|---:|:---:|
| 1965–1974 | 12.5% | 1.4% | 6/10 |
| 1975–1984 | 41.4% | 14.6% | 8/10 |
| 1985–1994 | 31.9% | 14.4% | 7/10 |
| 1995–2004 | 15.7% | 12.1% | 6/10 |
| 2005–2014 | 9.9% | 7.7% | 7/10 |
| 2015–2024 | 11.7% | 13.1% | 6/10 |
| 2025 (1 year) | 10.9% | 17.9% | 0/1 |
Berkshire beat the index in 40 of 61 years (66%), which means it lost in 21. The long-run gap was not built by winning every year. Decade figures are compounded from the official yearly numbers.
The last ten years, year by year:
| Year | Berkshire | S&P 500 | Gap |
|---|---:|---:|---:|
| 2016 | 23.4% | 12.0% | +11.4 |
| 2017 | 21.9% | 21.8% | +0.1 |
| 2018 | 2.8% | (4.4)% | +7.2 |
| 2019 | 11.0% | 31.5% | -20.5 |
| 2020 | 2.4% | 18.4% | -16.0 |
| 2021 | 29.6% | 28.7% | +0.9 |
| 2022 | 4.0% | (18.1)% | +22.1 |
| 2023 | 15.8% | 26.3% | -10.5 |
| 2024 | 25.5% | 25.0% | +0.5 |
| 2025 | 10.9% | 17.9% | -7.0 |
The gap is in percentage points: positive means Berkshire won, negative means it trailed the index. Figures in parentheses are losses, as in the official table.
Full 61-year data: [/data/berkshire-vs-sp500/latest.json](https://joelin.cc/data/berkshire-vs-sp500/latest.json) (CC BY 4.0; please cite Berkshire's annual report as the original source)
## Laid out year by year: the two most counterintuitive things
The first: nearly all of the excess return came in the first half.
From 1975 to 1984 Berkshire compounded at 41.4% a year against 14.6% for the index; from 1985 to 1994 it was 31.9% against 14.4%. But over the ten full years 2015–2024 Berkshire returned 11.7% a year and the index 13.1%: Berkshire was behind. It also trailed in 2025 alone (10.9% against 17.9%).
That does not mean Berkshire got worse. It is the arithmetic of size: the pool of possible investments for hundreds of billions of dollars is not the pool available to a few tens of millions, a point Buffett himself has made for years. The real lesson of this table is that the Buffett-era figure of 19.7% describes a history containing very different stages; using it as an expectation for the future points you in the wrong direction.
The second: the win rate. In Buffett's 61 years as CEO Berkshire won 40 and lost 21, a 66% win rate. The excess return was not built from small wins every year. A few big years opened the gap (in 1976 Berkshire beat the index by 105.7 percentage points, in 1979 by 84.3), and smaller losses in down years protected it (in 2022 the index fell 18.1% while Berkshire rose 4.0%). That is an asymmetric return pattern, not steady dominance.
## Notes on the data
* The Berkshire column is the official "annual percentage change in per-share market value". Berkshire pays no dividend, so the share-price change is its total return.
* The S&P 500 column is the total return with dividends from the same row of the official table.
* An earlier version of this article compared Berkshire with VTI (Vanguard Total Stock Market ETF). VTI only launched in 2001, so windows of 30 years or more relied on an estimate from the long-run US market average. Using the official S&P 500 column instead makes every window an actual figure.
### Three common mistakes when citing these figures
The first is copying the wrong column. Through the 2018 annual report the official table had three columns: change in per-share book value, change in per-share market value, and the S&P 500 with dividends. The book-value column appeared for the last time in the 2018 report; from 2019 there are only two. Some of the "Buffett returned 20.x% a year" figures circulating online come from that discontinued column, and the 20.1% (1965–2023) in the earlier version of this article was also an outdated figure.
The second is ignoring that the two columns are not measured the same way. Berkshire's column is a share-price return; the S&P 500 column includes dividends. Through 2018 the official table stated that the S&P 500 figures were pre-tax and Berkshire's after-tax. That footnote was removed starting in 2019, but the mismatch did not go away: a strict comparison of the two columns has to state it.
The third is reusing last year's annualized figure. The since-1965 figure changes every year: the 2024 annual report showed 19.9%, the 2025 report 19.7%. Any article that hard-codes an annualized figure without naming the report year will be wrong a year later; every table in this article is generated from the official yearly data and updates automatically.
## How the annualized return is calculated: CAGR
For the formula, see [ETFs with a CAGR above 10% over 20 years](/p/6212) (in Chinese).
### Why CAGR?
Berkshire's annualized figures are based on the growth of the share price and do not involve the timing of any cash flows, so the compound annual growth rate (CAGR) is the more suitable measure.
### Why not XIRR?
XIRR annualizes returns for irregular cash flows. It is normally used for an individual investor's or a fund's cash-flow analysis, not for a plain share-price return.
A related measure that often gets mixed up is the [time-weighted return (TWR)](/en/p/8097).
When the industry compares fund managers or trading strategies it uses TWR rather than XIRR, because the question is how good the strategy is, not how one particular investor happened to time their deposits.
## If Buffett had started in 1965 with just 10,000, how much would it be worth now?
Suppose you put 10,000 into Berkshire and 10,000 into the S&P 500 (with dividends) from the first year of the official table (1965). At the end of each decade you would have:
| Year-end | Berkshire | S&P 500 |
|---|---:|---:|
| 1974 | 32,341 | 11,477 |
| 1984 | 1,030,602 | 44,911 |
| 1994 | 16,479,311 | 171,681 |
| 2004 | 70,970,629 | 537,052 |
| 2014 | 182,252,464 | 1,125,620 |
| 2024 | 549,043,816 | 3,856,613 |
| 2025 | 608,889,591 | 4,546,947 |
By the end of 2025, the 10,000 in Berkshire would be about 608,889,591 (60,889 times) and the S&P 500 stake about 4,546,947 (455 times). By the rule of 72, 19.7% a year doubles money roughly every 3.7 years, which works out to about 15.9 doublings over 61 years. Amounts are compounded from the official yearly figures, before taxes and trading costs; the currency does not change the multiple.
Pretty remarkable, isn't it?
## How remarkable is Buffett compared with ordinary investors in Taiwan?
Joe writes from Taiwan, and this section compares Buffett with the Taiwanese retail investors his readers know. According to what Joe found, a figure circulating inside Taiwanese brokerages is that only 1% of accounts make money: see [Only 1% of Taiwan stock investors earn a positive return?](/p/6449) (in Chinese). Treat that as an industry rumor rather than an official statistic.
The point is that simply making money is hard, and beating the index is harder still.
## How have Joe's own investments done?
After Buffett's astonishing record, how does Joe himself compare? These are Joe's personal accounts: the US figures update automatically every month, while the Taiwan figures are a snapshot from early 2025.
### US stocks
Joe's own US stock account (in US dollars, dividends reinvested), from his first deposit on 2015-04-21 through 2026-09-30:
* **Year to date (YTD): 21.45%**, versus 12.47% for VTI (the US total-market ETF) over the same period. This is the cumulative return since the start of 2026, not an annualized figure.
* **Annualized TWR: 17.36%**. This is the same kind of measure as Buffett's annualized return (it looks only at the investing itself, regardless of when money was added), so the two can be compared. VTI returned 13.22% over the same period; in the period table earlier, the last 10 years (2016–2025) show 14.3% for Berkshire and 14.8% for the S&P 500. The periods don't match exactly, so treat it as a rough comparison.
* **XIRR: 16.87%**. This counts the timing of every deposit, so it shows how much Joe's money actually earned; putting each deposit into VTI on the same day would have earned 14.30%. This figure can't be compared with Buffett's.
These figures update automatically each month from Joe's statements; 2015–2017 is reconstructed from trade records and is an estimate.
[Joe's US stock performance and trading record](/p/1653) (in Chinese)
### Taiwan stocks
Joe's Taiwan holdings are mainly financial stocks. As of February 2025 his XIRR reached 10.87%, against 10.04% for 0050, the ETF that tracks Taiwan's 50 largest listed companies.
[Joe's Taiwan stock performance record](/p/1602) (in Chinese)
### Chinese stocks
After tallying it up, Joe just felt sad.
[Joe's Chinese stock performance record](/p/7613) (in Chinese)
## FAQ
### What is Warren Buffett's annualized return?
Over Buffett's 61 years as CEO (1965–2025), Berkshire's official 2025 annual report puts the compounded annual gain in per-share market value at 19.7%, against 10.5% for the S&P 500 with dividends included. That era has ended, so these figures will not change. The "since 1965" figure, which will include 2026 and later years, and the 1- to 50-year windows are updated with every annual report; see the tables in this article.
### Has Warren Buffett retired? Who runs Berkshire now?
Buffett stepped down as CEO at the end of 2025, and Greg Abel has been President and CEO since January 1, 2026. Buffett initially stayed on as Chairman; on September 18, 2026 he became Chairman Emeritus and remains a director, and his son Howard G. Buffett succeeded him as Chairman of the Board (Berkshire press release).
### Did Berkshire beat the market every year?
No. In the 61 years Buffett was CEO, Berkshire beat the index in 40 and trailed in 21, a win rate of about 66%. In the ten full years 2015–2024 Berkshire returned 11.7% a year, behind the index's 13.1%, and it also trailed in 2025. Most of the long-run excess return came from 1975 to 1994.
### Can the two columns of the official table simply be subtracted?
Only with caution. The Berkshire column is the change in per-share market value; the S&P 500 column is a total return with dividends. Through 2018 the official table also noted that the S&P 500 figures were pre-tax while Berkshire's were after-tax. Year-by-year gaps show the trend, but they are not a precise measure of excess return.
### Why do some sources say Buffett returned more than 20% a year?
Usually because they copied the discontinued "per-share book value" column, or quoted an older edition (the 2024 annual report showed 19.9%). The book-value column was dropped from the official table starting in 2019. The 20.1% (1965–2023) in the earlier version of this article was also an outdated figure.
### How often are the figures in this article updated?
Once a year. Berkshire usually publishes its annual report on the last Saturday of February at 8 a.m. US Eastern time; a scheduled job then fetches the new PDF, re-parses it and updates the holding-period table, the year-by-year table and the era breakdown in this article.
## References
* Berkshire Hathaway annual report, "Berkshire's Performance vs. the S&P 500": [2025 shareholder letter (PDF)](https://www.berkshirehathaway.com/letters/2025ltr.pdf)
* The yearly data compiled by this site (updated automatically): [/data/berkshire-vs-sp500/latest.json](https://joelin.cc/data/berkshire-vs-sp500/latest.json)
* Buffett becomes Chairman Emeritus: [Berkshire press release, September 18, 2026 (PDF)](https://www.berkshirehathaway.com/news/sep1826.pdf)
### Further reading
* [US wealth distribution tables](/p/100143) (in Chinese): the same data-page approach applied to US household wealth
* [Who compiles the index behind your ETF?](/p/100118) (in Chinese): the index providers behind the S&P 500 benchmark
* [Joe's Taiwan wealth report series](/p/8419) (in Chinese): Joe's notes on wealth and money, collected as a series
Sources: Chinese original first published 2025-03-06 (Taipei time) and rewritten on 2026-10-27 to use Berkshire Hathaway's official yearly table, absorbing the former year-by-year table page; figures update automatically with each annual report. Leadership facts checked 2026-10-27. Joe's own returns are dated snapshots from early 2025.
AI-assisted translation and editing: Caddy (AI)
[Original article](/p/6459)