---
title: 'Japan’s Photo Booth Leader FURYU Changes Course: Photo Sessions Fall Nearly 40%, but Photo Subscriptions Outearn Machines'
url: https://joelin.cc/en/p/1918
source: https://joelin.cc/en/p/1918
lang: en
pubDate: '2026-10-12'
date_modified: '2026-10-12'
description: FURYU’s financial reports reveal falling photo booth use, subscriptions overtaking arcade machine revenue, and a shift toward character merchandise, with a 2016–2026 usage comparison.
author: joe
ai_role: ai_only
translation_of: /p/1918
about:
- name: FURYU
sameAs:
- https://www.wikidata.org/wiki/Q11333792
mentions:
- name: OMRON Corporation
sameAs:
- https://www.wikidata.org/wiki/Q501376
- name: SEGA
sameAs:
- https://www.wikidata.org/wiki/Q122741
---
# Japan’s Photo Booth Leader FURYU Changes Course: Photo Sessions Fall Nearly 40%, but Photo Subscriptions Outearn Machines
## Summary
FURYU’s financial reports from 2022–2026 trace a change in direction at Japan’s leading sticker photo booth company. The central insight: photo subscription revenue has overtaken arcade machine revenue. Photo session volume fell 38.7% over six years, and segment revenue declined 2.9%, yet segment profit rose 14%. The company’s revenue mix has shifted from photo booths and character merchandise each accounting for roughly 43% to character merchandise contributing 61.9% and photo booths falling to 32.1%. SEGA returned to the market in October 2020, reshaping the industry.
This article also incorporates this site’s August 2026 nationwide census of Japan: 2,010 venues and 6,229 machine-model listings. These are neither IR disclosures nor official statistics. The census supplies a machine-count denominator that FURYU stopped disclosing from FY2017/3 onward, allowing an estimate that monthly photo sessions per machine fell from approximately 572 to approximately 410 over ten years. Annual revenue per machine is explicitly treated as noncomparable and is not estimated, because the old and new segment definitions include different businesses.
### Key facts
- In FY2026, subscription revenue rose to ¥6.82 billion, overtaking arcade machine revenue of ¥6.12 billion for the first time.
- Photo session volume fell 38.7% over six years, from 45.49 million to 27.87 million sessions. Revenue declined 2.9%, while profit rose 14%.
- The Worldview Business accounts for 61.9% of company revenue, while photo booths have fallen to 32.1%. The company is becoming an IP retail business.
- SEGA returned in October 2020. Overseas subsidiaries and entry into the capsule toy market are also part of the industry’s restructuring.
- This site’s census, checked on August 28, 2026, is neither IR data nor official statistics: 2,010 venues across Japan and 6,229 machine-model listings, including 5,621 for FURYU. That count equals 98.6% of the approximately 5,700 machines cited in the manufacturer’s publicity materials.
- Using this site’s census as the denominator, monthly photo sessions per machine fell from approximately 572 in FY2016/3 to approximately 410 in 2026. Annual revenue per machine is not comparable under the old and new segment definitions.

## Company profile: FURYU’s origins in OMRON, independence, and Tokyo Stock Exchange listing
FURYU(フリュー株式会社)began as an entertainment business inside OMRON Corporation, the Japanese manufacturer of automation controls and electronic equipment. The business launched in April 1997 and entered the sticker photo booth business in April 1998. In July 2003, it was spun off into オムロンエンタテインメント, a wholly owned OMRON subsidiary. It became independent through a management buyout, or MBO, in April 2007, creating today’s フリュー株式会社. It listed on the First Section of the Tokyo Stock Exchange on December 18, 2015, under securities code 6238.
Its main operations now fall into three areas: photo booths and photo subscriptions, under ガールズトレンドビジネス; character merchandise and crane game prizes, under 世界観ビジネス; and new businesses. Sections 5-2 and 5-3 below cover the full company history and its share price since listing.
(September 2026 correction: This paragraph originally stated that “Furyu was separated from OMRON as an independent company in July 2003.” In fact, it became a wholly owned OMRON subsidiary in 2003; independence came with the management buyout in 2007.)
## Joe’s note on the August 2026 revision
I first wrote this page in September 2022. Four years later, FURYU has changed considerably—and the direction of that change is different from what most people might expect.
Rather than deleting and rewriting the old article, I have arranged the page chronologically: the latest research from August 2026 comes first, followed by the complete original September 2022 text, preserved without changing a word—including that “94%.” The old article’s value lies in its record of what the market looked like then, rather than in whether its claims remain valid today.
(The figures below all come from FURYU’s official IR documents: earnings summaries and earnings presentation materials disclosed through TDnet. All amounts remain in Japanese yen, using the official original unit of millions of yen; they have not been converted to Taiwan dollars. The verification date was August 8, 2026, and the research includes FY2027/3 first-quarter results disclosed on August 7, 2026.)
You will encounter Japanese financial reporting terms such as セグメント利益 and 決算短信. Following this page’s longstanding practice, Section 10 includes a table of meanings and pronunciations. If a term is unfamiliar, you can jump there to look it up.
## 1. The most counterintuitive finding: Photo subscriptions now bring in more money than arcade machines
FURYU’s photo booth business is now called ガールズトレンドビジネス, or GTB—the Girls’ Trend Business. Breaking down this segment reveals what I consider the most important takeaway from this article.
| Within GTB (¥ million) | FY2024/3 | FY2025/3 | FY2026/3 | FY2027/3 Q1 |
| --- | --- | --- | --- | --- |
| Photo booths: amusement arcade installations (AM facilities) | 7,470 | 6,974 | 6,116 | 1,259 |
| Photo booths: directly operated stores | 1,401 | 1,266 | 1,160 | 222 |
| Pictlink (cloud subscriptions) | 6,402 | 6,184 | 6,822 | 1,804 |
| Other | 635 | 393 | 251 | 54 |
| GTB new businesses | — | — | 38 | 53 |
| GTB total | 15,910 | 14,818 | 14,388 | 3,393 |
(Sources: earnings presentation materials P24 p.9 / P25 p.9 / P26 p.13 / P27Q1 p.12.)
Look at FY2024/3: machines installed in amusement arcades brought in 7,470, compared with 6,402 from cloud subscriptions. Machines were clearly ahead.
Then look at FY2026/3: machine revenue fell to 6,116, while subscriptions rose to 6,822. The two lines crossed.
By the first quarter of FY2027/3, the gap had widened to 1,804 versus 1,259.
This is a photo booth company whose photo subscriptions have, for the first time, earned more than its arcade photo machines. Machines are shifting from “the thing that makes money” to “the entry point for recruiting subscribers.” You walk into an arcade and take photos once; the real business is the monthly fee you pay afterward to download those photos.
### A different charging structure makes declining volume more profitable
Over the same period, GTB’s revenue fell while its profit rose:
| GTB | FY2025/3 | FY2026/3 | Change |
| --- | --- | --- | --- |
| Revenue | 14,818 | 14,388 | −2.9% |
| Segment profit | 3,147 | 3,589 | +14.0% |
(Source: earnings summary T26 p.16 / p.17.)
Revenue fell 2.9%, while profit rose 14.0%. That did not come from expanding the business; it came from changing how customers were charged.
What changed? On July 1, 2025, FURYU consolidated all Pictlink paid plans into a single “Premium Membership” plan.
| Pictlink members | FY2025/3 | FY2026/3 | FY2027/3 Q1 |
| --- | --- | --- | --- |
| Paid members at period-end | 1.37 million | 1.27 million | 1.18 million |
| Of whom: Premium Members | 200,000 | 1.25 million | 1.18 million |
🔴 There is a trap in this table, so read the figures together: the jump in Premium Members from 200,000 to 1.25 million does not mean sixfold growth. The July 1, 2025 price unification changed the definition of “Premium Member” itself. Previously, it meant the small group that had selected the higher-tier plan; afterward, it effectively meant nearly all paid members. FURYU’s official wording was that “1.25 million of 1.27 million paid members had become Premium Members, with price unification approximately 98% complete.” By FY2027/3 Q1, it was “1.18 million out of 1.18 million, 100% complete.”
The before-and-after figures do not measure the same thing and cannot be joined into a growth curve. What actually changed was the price paid by the same customer base, rather than the number of customers.
## 2. Dividing the numbers: One photo session, one member, one machine
The figures above are large segment-level totals. This section divides them to examine unit economics. First, a clarification: the “average revenue received per session” and “ARPU” below are my calculations from IR figures, not officially disclosed metrics. Each numerator and denominator comes from official tables for the same year and reporting scope. The formulas appear below the tables, with results rounded to the nearest yen.
A frequently misunderstood point about the business structure: FURYU does not take a revenue share from amusement arcades. It sells machines to arcades at close to cost, then earns recurring revenue by supplying sticker consumables. The coins customers put into a machine go to the arcade, not to FURYU. Consequently, “how much FURYU receives per photo session” means two different things across the two channels:
| Average revenue received per photo session (yen/session; calculated here) | FY2023/3 | FY2024/3 | FY2025/3 | FY2026/3 |
| --- | --- | --- | --- | --- |
| Arcade channel (machine + consumables sales ÷ arcade photo sessions) | 237 | 246 | 258 | 239 |
| Directly operated stores (store revenue ÷ store photo sessions) | 474 | 481 | 494 | 504 |
(Formula: GTB subcategory sales ÷ corresponding photo sessions. Subcategory sales: P24 p.9 / P26 p.13. Photo sessions: P26 p.44. Both use the reclassified reporting scope; the calculation does not cross the reporting break.)
Two points stand out.
First, revenue received per session at directly operated stores rose for three consecutive years, reaching ¥504 in FY2026/3. The chronological format reveals an interesting connection: scroll down to the historical article, and you will find a target copied from the IR materials in 2022—“raise it to 500 per session.” Four years later, the directly operated store channel really did cross that threshold.
Second, the arcade channel brings in only ¥239 per session. Its revenue being roughly half that of directly operated stores is a matter of different roles, rather than efficiency: in arcades, FURYU supplies equipment and consumables; at its own stores, it is the retailer and books the full payment. Approximately 90% of photo sessions take place in arcades—25.56 million versus 2.30 million in FY2026/3. The bulk of FURYU’s photo booth revenue is therefore fundamentally a “selling shovels” business, rather than a store operation.
### How much does one member pay each month? Pictlink ARPU
| Calculated here | FY2023/3 | FY2024/3 | FY2025/3 | FY2026/3 |
| --- | --- | --- | --- | --- |
| Pictlink monthly ARPU (yen/member/month) | 354 | 363 | 376 | 448 |
(Formula: annual Pictlink sales ÷ 12 ÷ paid members at period-end. ⚠️ This uses the period-end count rather than the average membership during the year. Membership declined quarter by quarter in FY2026/3, so actual average ARPU would be slightly below 448. The calculation is intended only to show scale and direction.)
In the year of price unification, monthly ARPU jumped from ¥376 to ¥448, an increase of 19%. This cell contains the engine behind Section 1’s “lower volume, higher profit”: there were 100,000 fewer members, but each remaining member paid seventy-something yen more per month.
### How much does one machine do each month? Only 2016 could be calculated
This was the one number in this section that could not be calculated through to the present. FURYU disclosed its machine count only in its FY2016/3 earnings presentation: 6,091 machines, in P16 p.10. It did not disclose the count again over the following ten years. Consequently, the calculation for “monthly revenue per machine” was limited to the 2016 cell:
| FY2016/3 (calculated here) | Value |
| --- | --- |
| Average monthly photo sessions per machine (41.79 million total sessions ÷ 6,091 machines ÷ 12) | Approximately 572 sessions/machine/month |
| Annual FURYU-side revenue per machine (old Print Sticker Business revenue of ¥8,850 million ÷ 6,091 machines) | Approximately ¥1.45 million/machine/year, or approximately ¥120,000 per month |
(⚠️ The second row’s numerator is sales from the old プリントシール事業, or Print Sticker Business. It includes machines, consumables, and directly operated stores, but excludes Pictlink, which belonged to another segment at the time. This is a rough allocation of FURYU-side revenue across machines, rather than the amount consumers spent at the machines.)
FURYU’s IR materials stopped providing the current machine count, leaving a ten-year break in this calculation on the IR side. In August 2026, this site supplied the denominator through its own nationwide census of Japan. The following subsections explain the nature of that data and what can and cannot be compared.
Current IR materials also cannot tell us “how many photos are printed each month.” Recent disclosures give photo session counts but not print counts. The historical article preserves quarterly print counts recorded in 2022, a disclosure available in the earlier era of IR reporting.
### Where the denominator comes from: This site’s nationwide census of Japan, neither IR data nor official statistics
Before discussing what these figures can be used for, their status needs to be clear.
The venue and machine figures below are not FURYU IR disclosures, nor statistics from the Japanese government or any third-party market research organization. They come from a census conducted by this site: a nationwide scan of five operators’ official installation maps and official store lists, checked on August 28, 2026.
The method can be explained in one sentence: divide Japan’s land area into a uniform grid of 13.0-kilometer squares and query the official map endpoints cell by cell. Each square’s half-diagonal is 9.19 kilometers, shorter than the empirically measured effective query radius of 9.6 kilometers. A single query therefore covers its entire cell, producing seamless coverage of Japan’s land area. This is a complete scan whose grid cells can be checked individually, rather than an extrapolation from a few major cities.
Results as of the verification date:
- 2,010 venues nationwide, with entries in all 47 prefectures.
- 6,229 machine-model listings: FURYU 5,621; SEGA 467; Photoism 107; Photomatic 25; 人生四格 9.
- An average of 3.1 machine-model listings per venue.
- FURYU machines were found at 1,873 venues.
The known limitations are listed plainly below, because they directly affect how these numbers should be read:
- Machine-model listings are not machine counts. Two machines of the same model at the same venue produce only one listing. The figure of 5,621 is therefore a lower bound on machine count, rather than the count itself.
- This is a snapshot as of the verification date. Photo booths are installed and removed frequently; rescanning a quarter later would produce different figures.
- Official maps do not necessarily list every model. Models absent from the official maps, such as Hyper shot, cannot be captured, and failure to find them does not prove they do not exist.
- Photoism’s 107 entries come from a static snapshot of its official store list dated August 6, 2026, rather than a fresh check on the census verification date.
- There is no official total against which to compare the results. The census can demonstrate “no missing geographic grid cells”; it cannot demonstrate “no stores in the official backend that have yet to appear on the map.” Those are separate questions.
### 2016 versus 2026: Which figures are comparable, and which are not?
With a denominator, the 2016 calculation can finally be extended. Before doing so, however, the reporting scopes must be aligned. FURYU reorganized its segments during those ten years. The two segment baskets contain different things; dividing them directly would create a false trend.
| Unit economics per machine | FY2016/3 | 2026 | Comparable? |
| --- | --- | --- | --- |
| Machine count (denominator) | 6,091 machines (IR: machines in operation) | Approximately 5,700 machines (manufacturer publicity, as of March 2024, not IR) / 5,621 machine-model listings in this site’s census (2026-08-28) | Comparable in scale, but not for precise increases or decreases |
| Monthly photo sessions per machine | Approximately 572 | Approximately 408–413 | Yes |
| Annual FURYU-side revenue per machine | Approximately ¥1.45 million | No figure provided in this article | No |
Monthly photo sessions per machine are comparable. The 2016 figure is 572. Divide FY2026/3’s 27.87 million total photo sessions by either 5,621 from this site’s census or approximately 5,700 from the manufacturer’s publicity materials, then divide by 12, and the result falls between 408 and 413. Over ten years, monthly sessions per machine declined from approximately 572 to approximately 410, a reduction of roughly 28%.
This figure matters because it translates Section 4’s observation that “the underlying market is shrinking” into the scale of a single machine. Over the same period, machine count declined by roughly less than 10%, from 6,091 to 5,621–5,700, while total photo sessions fell by one-third, from 41.79 million to 27.87 million. Put together, those two figures point to one conclusion: machines have not been removed on a massive scale; fewer people are lining up in front of each machine.
There are three sources of error to remember when reading this calculation. The numerator is the annual FY2026/3 figure, while the denominator is either a March 2024 count or the August 2026 census, so the dates do not align exactly. Machine-model listings are a lower bound on machine count, and using them as the denominator overstates sessions per machine. Finally, the IR definition of “machines in operation” may differ from the publicity materials’ “installed machines.” This calculation therefore shows scale and direction, rather than precise annual changes.
Annual revenue per machine is not comparable, and this article provides no current figure. The 2016 numerator is revenue from the old Print Sticker Business: machines, consumables, and directly operated stores, but no Pictlink, which was recorded under a different segment that year. Today’s GTB includes the four pillars in Section 1’s table plus new businesses, with Pictlink inside the basket. Dividing total GTB revenue by machine count would allocate monthly subscription fees to machines, producing a false “growth in revenue per machine.”
It would be possible to assemble something that looks comparable: adding GTB’s arcade and directly operated store channels appears to resemble the old basket. But the official disclosures do not specify the boundaries of every component in that old basket, so the reconstructed figure cannot be verified. What I cannot find, I cannot find. This cell follows the longstanding rule in Section 9: no estimates.
### Three cross-checks: Do the census figures agree with IR?
The usefulness of independently collected data depends on whether it matches independent external sources, rather than on whether its numbers look impressive. This census offers three reconciliation points.
First, machine counts. This site’s census contains 5,621 FURYU machine-model listings. Public material from FURYU’s publicity team gives an installed count of “approximately 5,700 machines,” as of March 2024. This is publicity material, not an IR document, and must be identified as such when cited. The census count is 98.6% of that figure. This comparison uses no shared intermediate variable: one total comes from counting official map entries grid cell by grid cell; the other is the manufacturer’s published total. The two paths were generated independently.
Second, directly operated stores—a stricter check. Section 4 cites IR store counts of 39 at FY2025/3 year-end, 34 at FY2026/3 year-end, and 32 as of June 2026. Without consulting IR, this site’s census counted FURYU’s three directly operated store brands from the official map: girls mignon, petit mignon, and moreru mignon. There were 33 store-name listings at 32 addresses. The Maihama イクスピアリ location carries both girls mignon and moreru mignon signs at the same address, so it counts as one venue. The 32 disclosed in the financial report matches the 32 counted in the independent census.
This check works in both directions: it indicates that the census did not miss FURYU’s directly operated stores, and that the IR figure of 32 was not merely a casual approximation.
Third, verification of the operating model. This check answers the question at the start of this section: “selling shovels or running stores?” Of the 2,010 venues recorded by this site, 1,873 had FURYU machines, or 93.2%. 🔴 The denominator for this 93.2% is “venues included in this site’s census,” rather than the full population of photo booth venues across Japan. It is therefore not market share and must never be cited as market share under any circumstances. Section 7 explains why a market share claim cannot be established in this article.
Yet in that same dataset, FURYU operates only 32 stores itself. Its brand appears at more than 90% of recorded venues, while its own stores number only thirty-something. This is the venue-level expression of the statement at the beginning of this section that “FURYU does not take a revenue share from amusement arcades”: its machines are installed in other people’s premises, and it earns from equipment and consumables. The figure of 32 measures the scale at which it acts as the store operator.
### Pinning down a commonly misquoted number
While researching this section, I also clarified something else: Japan has no official statistic for “the number of photo booth venues.” Neither of the two figures commonly cited in Chinese-language discussions measures that.
| Commonly cited figure | What it actually measures | Source and year |
| --- | --- | --- |
| 8,548 stores | Total locations in the arcade game operating business, including crane game corners in supermarkets | JAIA, FY2023 |
| 4,184 | Business premises with a Category 5 license under the Entertainment Business Act, covering amusement arcade operations and similar businesses | 警察庁, end of 2025 |
These two figures use different definitions from each other, and both differ from “photo booth venue count.” They cannot be added to or subtracted from one another, nor used as comparison totals for this site’s 2,010 venues. Most locations in the first count have no photo booths at all; the second counts operating licenses, rather than machines. At present, answering “How many places in Japan offer sticker photo booths?” requires scanning the official maps.
The census’s prefecture-by-prefecture distribution and venue list are available separately on [this site’s Japan photo booth information site](https://photobooth.joelin.cc/japan/). FURYU’s models and brand information are on the [FURYU brand page](https://photobooth.joelin.cc/brand/furyu/).
## 3. What has been inside the GTB basket over the past ten years?
The name “photo booth segment” suggests it contains only photo booths. Ten years of IR documents show that the basket’s contents have kept changing. That history is useful industry evidence in its own right.
Under the old structure, through FY2023/3, there were two segments: プリントシール事業, the Print Sticker Business, covering machines, consumables, and directly operated stores; and コンテンツ・メディア事業, the Content and Media Business, covering Pictlink and other content services. The latter contained a line many people do not know about: colored contact lens sales. Revenue rose from ¥780 million in FY2017/3 to ¥1,229 million in FY2018/3 and ¥1,461 million in FY2019/3, according to P18 p.11 and P19 p.9. It nearly doubled over three years—an experiment in extending the “girls’ business” into adjacent beauty products.
From FY2024/3 onward, the current structure consolidated these operations into one GTB segment with four pillars: the arcade channel, directly operated stores, Pictlink, and Other. Peripheral offerings then progressively exited:
- The colored contact lens line, once included in the girls’ business, was transferred in its entirety in March 2025. The signing of the agreement was disclosed on March 5, 2025; see P26 p.14.
- “Other,” including デコメ and similar content services, shrank from ¥732 million in FY2023/3 to ¥54 million in FY2027/3 Q1, approaching zero.
Meanwhile, all the new openings point in the same direction: fan activities and IP. From FY2026/3, IR separately lists “GTB new businesses,” comprising IP photo booths, the fan-oriented photo booth offering “SUKELU factory,” and retouching services. Revenue was only ¥38 million in FY2026/3, but had already reached ¥53 million in FY2027/3 Q1; see P26 p.13, note 3. The amounts remain small, but the direction is clear: remove what is unrelated to photo booths, such as contact lenses, and add what is related to IP.
Over ten years, this basket has narrowed from “try every kind of business for girls” to two core businesses: photo booths and subscriptions. That narrowing and the Worldview Business’s expansion in the next section are two sides of the same decision.
## 4. The underlying market is shrinking: Down 38.7% in six years
The crossover in Section 1 happened against the following backdrop:
| Photo booth operating metric | FY2020/3 | FY2021/3 | FY2022/3 | FY2023/3 | FY2024/3 | FY2025/3 | FY2026/3 |
| --- | --- | --- | --- | --- | --- | --- | --- |
| Total photo sessions (units of 10,000 sessions) | 4,549 | 3,018 | 3,197 | 3,375 | 3,330 | 2,957 | 2,787 |
| Of which: amusement arcades (units of 10,000 sessions) | 4,212 | 2,804 | 2,947 | 3,090 | 3,039 | 2,701 | 2,556 |
| Directly operated stores at period-end | 33 | 36 | 33 | 35 | 37 | 39 | 34 |
(Sources: earnings presentation materials P22 p.48 / P24 p.46 / P26 p.44.)
Total photo sessions fell from 45.49 million in FY2020/3 to 27.87 million in FY2026/3, a decline of 38.7% over six fiscal years.
There was a rebound in between. After the pandemic drove volume down to 30.18 million sessions, it recovered to 31.97 million, 33.75 million, and 33.30 million in FY2022/3 through FY2024/3, suggesting a recovery might be underway. Then it fell again. This was not a one-off hole caused by the pandemic; the pandemic accelerated a decline that was already underway.
Paid membership is moving in the same direction.
Pictlink’s period-end paid membership declined from 1.64 million in FY2019/3, the high point in this series, to 1.27 million in FY2026/3, and then to 1.18 million in FY2027/3 Q1. Of those eight fiscal years, only FY2023/3 showed a rebound.
The directly operated store signal is even clearer: after reaching 39 stores in FY2025/3, the count contracted to 34 in FY2026/3 and stood at 32 as of June 2026. This is the familiar pattern of expanding first, then closing stores that do not pay their way.
FURYU’s own forecast for FY2027/3 is approximately 29 million photo sessions and 1.27 million paid members at the end of March 2027; see P26 p.18. The company itself does not expect this trajectory to reverse.
## 5. The company is shifting its center of gravity: Six-tenths of revenue already comes from outside photo booths
This is the biggest change over the past four years, and one many people have not caught up with.
| Share of total company revenue | FY2022/3 | FY2023/3 | FY2024/3 | FY2025/3 | FY2026/3 | FY2027/3 Q1 |
| --- | --- | --- | --- | --- | --- | --- |
| Worldview Business (character merchandise) | 44.6% | 44.9% | 54.5% | 57.2% | 61.9% | 67.9% |
| GTB (photo booths) | 43.3% | 43.3% | 37.2% | 33.4% | 32.1% | 28.2% |
| FNB (new businesses) | 12.2% | 11.8% | 8.3% | 9.4% | 6.0% | 3.9% |
| Total company revenue (¥ million) | 34,058 | 36,400 | 42,768 | 44,305 | 44,767 | 12,019 |
(Sources: earnings summaries T24 p.17 / T26 pp.16–17 / T27Q1 p.11. Each share is segment sales divided by the total in the same official table.)
Four years ago, photo booths and character merchandise were almost evenly split, at 43.3% versus 44.6%. Now the split is 32.1% versus 61.9%, widening further to 28.2% versus 67.9% in the latest quarter.
What is the Worldview Business? Primarily the prizes and figures people win from crane games. The machines themselves belong to the arcades; FURYU makes the goods inside them. In FY2026/3, this line generated ¥19,624 million, alongside overseas merchandise sales of ¥3,620 million, high-end figures of ¥2,867 million, and lottery-type merchandise of ¥1,593 million.
A more accurate framework is “IP retail.” Most of the IP FURYU handles is not its own. It obtains other people’s IP, develops merchandise itself, carries the inventory itself, and operates the channels itself. It earns the gross margin across the entire journey from IP to shelf, rather than a licensing fee.
Photo booths remain the company’s public face, but they ceased to be its main revenue business long ago.
### Two initiatives underway in 2026 point in the same direction
This shift is more than a change in percentages; concrete moves are underway:
- Establishing an overseas subsidiary: FURYU disclosed a notice on establishing an overseas subsidiary on March 18, 2026, and a progress report on June 18, 2026. By FY2027/3 Q1, 广州芙游娯楽有限公司 had formally entered the scope of consolidation; see T27Q1 p.1.
- Entering the capsule toy market: On June 22, 2026, FURYU announced its decision to enter the capsule toy market, explicitly stating that it would expand the business using the Worldview Business’s ability to secure IP and develop products. Sales were scheduled to begin in December.
Neither initiative belongs to the photo booth line.
### A comparison with Taiwan: IP is being pushed into retail (my observation, not IR data)
Looking at the Worldview Business through a Taiwanese lens makes its activity easier to understand. There is a very clear trend in Taiwan’s IP industry in 2026: brand licensing and marketing collaborations alone are no longer enough to survive. IP businesses are all moving toward retail—developing products themselves, carrying their own inventory, and building distribution channels. Without retail, there is no next year.
FURYU’s Worldview Business is the mature version of that path, developed over ten years. It handles the entire chain from IP to physical merchandise to shelf: crane game prizes distributed to amusement arcades across Japan, ranking second in the industry; a capsule toy line entering in December; and an overseas merchandise operation for which it is establishing its own subsidiaries. Its IR even discloses the average remittance exchange rate used for purchasing—¥150.1 per US dollar in FY2026/3. Disclosing that figure indicates that FURYU itself bears inventory and exchange-rate risk, rather than passing them to licensing partners.
Licensing earns a royalty share; retail earns the entire gross margin, at the cost of internalizing risk. The lesson Taiwan’s character and illustration IP businesses are collectively learning this year is the one FURYU began practicing ten years ago: the ultimate monetization of IP lies on the shelf, rather than in licensing fees.
### But there is a tension pulling in the opposite direction that few people discuss
Looking only at revenue could lead to the conclusion that photo booths have been marginalized. Profit tells a different story:
| Segment profit (¥ million) | FY2022/3 | FY2023/3 | FY2024/3 | FY2025/3 | FY2026/3 | FY2027/3 Q1 |
| --- | --- | --- | --- | --- | --- | --- |
| Worldview Business | 2,375 | ▲189 | 1,710 | 1,768 | 2,337 | 866 |
| GTB (photo booths) | 3,536 | 4,223 | 4,421 | 3,147 | 3,589 | 841 |
| FNB | ▲762 | ▲310 | ▲574 | ▲430 | ▲454 | ▲90 |
(Sources: earnings presentation P26 p.41 / earnings summaries T24 p.17 / T26 pp.16–17 / T27Q1 p.11. These figures are “segment profit or loss” before allocation of company-wide expenses.)
In each of the past five fiscal years, photo booths were the most profitable of the three segments. They accounted for only about 30% of revenue, yet carried the largest share of profit.
The center of revenue has moved away from photo booths, but they remain the profit engine. That is FURYU’s actual position today: it is using the money earned from photo booths to support another, larger business.
The latest quarter deserves attention: Worldview profit of 866 versus GTB profit of 841. The quarterly profit gap between them has narrowed to within ¥25 million. If this trend continues, FURYU will, for the first time, become a company whose most profitable business is also no longer photo booths.
## 5-2. How this company came into being: From an internal OMRON business to the TSE First Section
You often see the statement that “FURYU entered the photo booth market in 1998,” but FURYU did not yet exist as a company in 1998. According to FURYU’s official history, the timeline is as follows:
| Date | Event |
| --- | --- |
| April 1997 | OMRON launched a new internal business in entertainment |
| April 1998 | That new business entered sticker photo booths |
| 1999 | OMRON launched the photo booth ハイキーショット, featuring eight levels of skin-brightening adjustment |
| December 2001 | Entered the mobile content business |
| January 2002 | Entered the crane game prize business, the starting point of today’s Worldview Business |
| July 2003 | Spun off into オムロンエンタテインメント, a wholly owned OMRON subsidiary |
| October 2006 | Management established a holding company for the acquisition; it was renamed フリュー in February 2007 |
| April 1, 2007 | The management buyout was completed, and フリュー took over all businesses and employees of オムロンエンタテインメント |
| December 18, 2015 | Listed on the TSE First Section |
| March 1, 2017 | Conducted a three-for-one stock split, bringing issued shares to 28,296,000 |
| April 2022 | Moved to the Prime Market following the TSE’s restructuring |
| June 2024 | Established FURYU of America in California, United States |
| June 2025 | Spun off the animation company フリュー・ピクチャーズ |
| May 2026 | Established a subsidiary in Guangzhou |
The row most easily misread is 2003. That year, FURYU’s predecessor merely changed from an OMRON department into an OMRON subsidiary; it remained under OMRON. Actual independence came through the management buyout in 2007.
### Why did OMRON let it go?
According to an interview with the first president, 田坂吉朗, OMRON itself recorded its first loss since listing around 2001, and the entertainment business was asked to choose among three paths: withdrawal, sale, or independence. The interview was published by a paid Japanese financial news outlet; I could read only the summary, so this is secondary information. The photo booth business had already returned to profitability in the fiscal year ended March 2000, and management chose independence.
The following is my inference, rather than OMRON’s explanation: for a company making control equipment and electronic components, photo booths and crane game prizes were small businesses outside its core operations. When the parent company fell into loss, businesses of this kind would be among the first reviewed. I could not find an official OMRON explanation of why it let the business go.
I could not find any public information about who financed the acquisition, how much was paid, or whether an investment fund participated.
### What it looked like before listing
After independence, two FURYU models shaped the aesthetics of the entire market. 美人-プレミアム-, launched in July 2007, started the big-eye trend; LADY BY TOKYO, launched in July 2011, brought the trend back toward a natural look. During the same period, competitors withdrew one after another. FURYU’s share of machines nationwide rose from roughly 30–40% in the early 2010s to approximately 98% in 2019. The latter figure comes from the company’s own survey. Year-by-year estimates and a table of competitor exits appear in [Thirty Years of Photo Booths in Japan](/p/9821).
Reports at the time of the listing, citing the prospectus, put revenue for the preceding year—the fiscal year ended March 2015—at approximately ¥23.9 billion. I did not obtain annual financial reports for 2007–2014, so this period has no figures here.
## 5-3. The share price since listing: Adjust for the stock split first
The terms at the December 18, 2015 listing were as follows:
| Item | Figure |
| --- | --- |
| Offering price | ¥3,200; the initial estimate was ¥3,780, with a bookbuilding range of ¥3,000–¥3,200 |
| Opening price on the first day | ¥3,220 |
| Shares in the public offering | 732,000 |
| Lead underwriter | 野村證券 |
These figures come from an IPO information compilation site and pre-listing reports. They are secondary sources, but agree with one another. The offering price and first-day opening price differed by only ¥20, leaving almost no premium on the listing day.
Before looking at the share price, one adjustment is essential: FURYU conducted a three-for-one stock split on March 1, 2017. The ¥3,200 listing price was a pre-split price; on today’s share basis, it is approximately ¥1,067. The following annual highs and lows come from Nikkei’s digital edition and are already adjusted for the split:
| Year | High | Low | Year-end close |
| --- | ---: | ---: | ---: |
| 2017 | 1,733 | 1,037 | 1,087 |
| 2018 | 1,145 | 868 | 1,019 |
| 2019 | 1,209 | 900 | 1,074 |
| 2020 | 1,501 | 747 | 1,141 |
| 2021 | 1,966 | 946 | 1,370 |
| 2022 | 1,386 | 894 | 1,089 |
| 2023 | 1,762 | 1,025 | 1,394 |
| 2024 | 1,382 | 891 | 1,110 |
| 2025 | 1,164 | 807 | 1,068 |
| 2026, through September 24 | 1,484 | 1,004 | 1,451, September 24 close |
The unit is Japanese yen. The closing price in the 2026 row is the September 24 price, rather than the year-end close.
Reading this table alongside the operating figures in the preceding sections highlights three points:
- The low of ¥747 occurred on March 13, 2020, just as the pandemic began and amusement arcades were facing closure. It was approximately 70% of the adjusted listing price.
- The high of ¥1,966 occurred on September 22, 2021, approximately 1.8 times the adjusted listing price.
- The September 24, 2026 close of ¥1,451 was approximately 36% above the adjusted listing price. With 28,296,000 shares, market capitalization was approximately ¥41 billion.
The often-heard claim that “FURYU’s share price has never returned to its listing price” therefore comes from directly comparing pre-split and post-split prices. On the same share basis, the current price is above the listing price.
Dividends per share for the fiscal years ended March 2022 through March 2026 were ¥52, ¥38, ¥39, ¥39, and ¥40, respectively. The company’s current policy uses either a 40% payout ratio or a 5% dividend-on-equity ratio, and commits to no dividend reductions under a progressive dividend policy. During the fiscal year ended March 2026, the share price rose from ¥965 to ¥1,229; the company calculated total return including dividends at 31.5%.
## 6. About SEGA: It returned in 2020, rather than 2025
The first version of this page’s August 2026 addendum stated that “SEGA returned to this market from July 2025.” After checking SEGA’s official announcements, I found that date was wrong and am correcting it here.
First, something more important than the date: プリクラ is a registered SEGA trademark. The first machine, プリント倶楽部®, was released by セガ/アトラス on July 25, 1995. Cumulative shipments had reached approximately 22,000 machines by the end of June 1997.
SEGA did more than “return to this market”—SEGA created it.
The actual timeline is as follows:
| Date | Event |
| --- | --- |
| 1995-07-25 | セガ/アトラス released the first プリント倶楽部® machine, establishing the entire category |
| Around 2000 | SEGA withdrew from the sticker photo booth business |
| 2020-10 | SEGA reentered after approximately 20 years, with fiz(フィズ) |
| 2024-04 | The arcade game business was transferred; the current operating entity is 株式会社セガ フェイブ |
| 2024-07-04 | GIMMI(ギミ)launched, with a “one-booth design” combining photography, decoration, and printing in a single room |
| 2025-07-03 | NICO MAKE(ニコメイク)launched, explicitly described by the official announcement as GIMMI’s successor |
| 2026-07-07 | cherrit(チェリット)launched, also carrying forward GIMMI’s single-room design |
What happened in July 2025 was therefore the launch of a new SEGA model, rather than SEGA’s return. The actual return was in October 2020.
SEGA’s official photo booth site currently lists five models in operation: cherrit, NICO MAKE, totolu, romakyun, and lalamee. That part of the original addendum was correct.
This correction matters because it changes how the “94%” in the next section should be read.
## 7. How should that “94%” be read now?
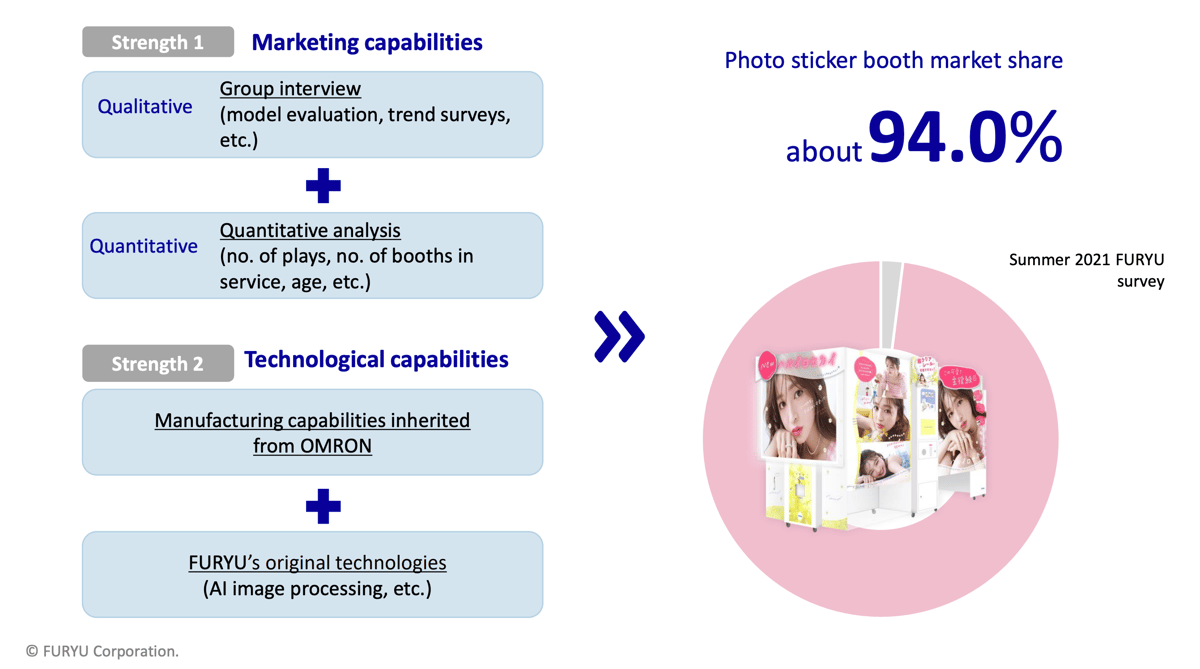
The old article states, “According to a 2021 survey, FURYU accounts for 94% of the Japanese market.” I have left that sentence unchanged in the historical section below. It needs three annotations, however.
First, the figure comes from FURYU’s own survey, rather than third-party statistics.
I compiled the installed-machine share disclosures in FURYU’s earnings presentation materials over the years. Each official entry identified the survey timing and the party conducting it:
| Disclosure document and date | Disclosed share | Officially stated survey timing and surveyor |
| --- | --- | --- |
| P20, 2020-05-22 | Approximately 98.0% | 2019, surveyed by FURYU |
| P21, 2021-05-21 | Approximately 95.0% | Summer 2020, surveyed by FURYU |
| P22, 2022-05-12 | Approximately 94.0% | Summer 2021, surveyed internally |
| P23, 2023-05-12 | Approximately 94.0% | Summer 2022, surveyed internally |
| P24, 2024-05-14 / P25, 2025-05-14 | No disclosure at all in either year | — |
| P26, 2026-05-14 / P27Q1, 2026-08-07 | Generalized wording, with no decimal figure | No survey timing stated |
Every entry is labeled 自社調べ or フリュー調べ: an internal survey or a FURYU survey. That does not mean the figures are false, but their status is “an operator’s own survey disclosed through IR,” rather than government statistics or figures from a third-party market research organization. That distinction must be clear when citing them.
Incidentally, P22 and P23 both state 94.0%, but the survey dates are summer 2021 and summer 2022 respectively. These are two independent figures that happen to have the same value, rather than repeated disclosure of the same dataset.
Second, the series broke in 2024, and the way it broke is revealing.
The FY2024 and FY2025 earnings presentations omit this page entirely. It returns from FY2026 onward, but the disclosure’s precision drops from “approximately XX.X%” to generalized wording without a decimal figure, and the survey date is no longer stated.
From 98.0 to 95.0 to 94.0 to 94.0, followed by two missing years and then no decimal figure: this is a series with progressively weakening precision. It should not be read as a continuous numerical series, much less used to describe the present with its oldest figure.
Third, the timing does not support that interpretation.
The old article’s 94% refers to a survey conducted in summer 2021. As established in the previous section, SEGA had already returned to the market in October 2020.
That 94% was measured after SEGA’s return. It never meant that “FURYU was the only company in the market.”
This article therefore makes no claim about FURYU’s current market share. No third-party statistics exist, and FURYU itself has not provided a precise figure in its most recent two years of disclosures. The only statement that can honestly be made is that the last internal survey with a decimal figure was conducted in summer 2022, and no comparable figure has been available since.
One related point: FURYU disclosed its actual machine count only once. The FY2016/3 earnings presentation stated “6,091 machines in operation,” in P16 p.10. From FY2017/3 onward, it never again disclosed an absolute machine count. Other machine-count figures circulating in Chinese-language discussions do not appear in FURYU’s IR documents.
## 8. Looking at Japan and Korea side by side
Over the past year, I have reviewed financial reports from several companies in the Korean-style photo booth camp. Comparing them with FURYU makes the differences clearer.
FURYU uses physical delivery to anchor a digital subscription. Machines earn almost nothing; sticker consumables and Pictlink subscriptions generate the money. The strength of this model is visible in the crossover in Section 1: market volume fell 38.7%, yet subscription revenue still reached a new high.
The Korean-style operators lack this additional layer. Among the companies I have reviewed:
- [Financial report research on 서북, PHOTOISM’s parent company](/p/9563): Korea’s market leader, with approximately 100 stores in Japan, nearly 60% of them inside existing amusement arcades; it still lost money in 2025.
- [Company research on PHOTOGRAY and its parent APR](/p/9557): a side business of a listed company.
- [Company research on Life4Cuts 人生四格 and its parent LK Ventures](/p/5324): the original pioneer, which entered a state of complete capital impairment in 2025.
- [The two-brand relay of Plan.B × PHOTO OBJET](/p/9582): an approach built around settings and experiences.
Almost all of these companies’ revenue occurs at the moment a photo is taken. Once the session is over, there is no second opportunity to charge. FURYU’s Pictlink is the only structure among them that turns a one-time purchase into a monthly fee. That is also why the company can hold up even while its market is clearly shrinking.
I have covered Taiwan’s development separately in these two articles: [A Historical Report on Taiwan’s Photo Booth and Korean-Style Photo Booth Industries](/p/5848), and [Joe’s 2025 Annual Review of Taiwan’s Photo Booth Industry](/p/8281).
## 9. What I could not find
I always include this section. What I cannot find, I cannot find; I do not estimate:
- Actual machine counts from FY2017/3 onward: FURYU’s IR documents did not disclose them again in any subsequent year. Manufacturer publicity outside IR separately gave an approximate figure of 5,700 machines; its status and source are explained in Section 2.
- The total number of photo booths in the Japanese market—the denominator for market share: this was not disclosed throughout the period, so the 94% could not be independently checked. (September 2026 addition: Industry-wide counts were subsequently found in trade association data: 7,711 machines in 2021 and 7,441 in 2023. See [Thirty Years of Photo Booths in Japan](/p/9821). However, FURYU has not disclosed its own machine count since 2017, leaving the numerator missing, so the share still cannot be verified.)
- The financing source and amount for the 2007 management buyout, annual financial reports for 2007–2014, and OMRON’s official explanation of why it let the business go: none could be found.
- Installed-machine share for FY2024 and FY2025: the relevant page is completely absent from both earnings presentations.
- SEGA’s machine count, market share, or revenue: SEGA does not separately disclose figures for its sticker photo booth business, so I cannot state the two companies’ current relative scale.
- Any FURYU IR assessment of SEGA: I searched all 24 IR documents from FY2016/3 through FY2027/3 Q1—12 earnings summaries and 12 earnings presentations—for セガ and SEGA. There were zero matches. FURYU has never mentioned this competitor in those IR materials.
- Annual figures for the Worldview Business’s four subcategories before FY2024/3: the official disclosures do not use the same format.
- Monthly print counts: recent IR gives photo session counts but not print counts, so Section 2 cannot derive “prints per machine per month.”
- The buyer and price in the colored contact lens business transfer: the disclosure states only the agreement signing and transfer timing; neither the buyer nor the consideration was disclosed.
## 10. Japanese terms used in this article: Meanings and pronunciations
When I wrote this page in 2022, I included a lesson at the end on breaking down and pronouncing ガールズトレンドビジネス; it remains in the historical section below. This revision introduces a set of financial reporting terms, so here is another lesson in keeping with that practice. Knowing how to pronounce these terms will also help when you read Japanese companies’ IR materials yourself.
### Financial reporting terms
| Japanese | Pronunciation | Meaning |
| --- | --- | --- |
| 決算短信(けっさんたんしん) | kessan tanshin | A listed company’s quarterly earnings summary. All documents labeled T16–T27Q1 in this article are of this type |
| 決算説明資料(けっさんせつめいしりょう) | kessan setsumei shiryō | Earnings presentation materials; labeled P16–P27Q1 in this article |
| 売上高(うりあげだか) | uriage-daka | Revenue |
| 営業利益(えいぎょうりえき) | eigyō rieki | Operating profit |
| セグメント利益 | segumento rieki | Segment profit. セグメント is a phonetic rendering of the English word “segment” |
| 有料会員(ゆうりょうかいいん) | yūryō kaiin | Paid member. 有料 means payment is required; it does not mean “containing materials,” as a literal Chinese reading might suggest |
| 自社調べ(じしゃしらべ) | jisha shirabe | Surveyed by the company itself—in other words, not third-party statistics |
| 稼働台数(かどうだいすう) | kadō daisū | Number of machines in operation |
| 設置台数シェア(せっちだいすう) | setchi daisū shea | Market share measured by installed machine count. シェア means “share” |
| 参入(さんにゅう)/撤退(てったい) | sannyū / tettai | Entering / withdrawing from a market |
| ▲ | — | The negative-number symbol used in Japanese financial reports: ▲454 means −454 |
| 百万円/万回/万人 | hyakuman-en / man-kai / man-nin | Millions of yen / units of 10,000 sessions / units of 10,000 people. These are the original units in Japanese financial reports; the article retains them when reproducing the official tables |
### Business and product terms
| Japanese | Pronunciation | Meaning |
| --- | --- | --- |
| プリントシール機 | purinto shīru ki | Sticker photo booth. プリント = print; シール = seal, meaning a sticker. The original 2022 article explained this breakdown |
| プリクラ | purikura | Short for プリント倶楽部. A registered SEGA trademark that later became a colloquial name for the whole category |
| ピクトリンク | Pikutorinku | Pictlink, FURYU’s subscription service for downloading photos |
| プレミアム会員 | puremiamu kaiin | Premium Member |
| 総プレイ回数(そう・かいすう) | sō purei kaisū | Total plays, meaning photo sessions |
| アミューズメント施設(しせつ) | amyūzumento shisetsu | Amusement arcade. “AM facilities” in the article’s tables is its abbreviation: third-party venues where the machines are installed |
| 直営店(ちょくえいてん) | chokuei-ten | Directly operated store |
| 世界観ビジネス(せかいかん) | sekaikan bijinesu | Worldview Business, meaning the character merchandise business; currently FURYU’s main source of revenue |
| クレーンゲーム景品(けいひん) | kurēn gēmu keihin | Crane game prizes. The machine belongs to the arcade; the goods inside it are FURYU’s |
| くじ | kuji | Lottery-type merchandise, such as 一番賞 |
| カプセルトイ | kapuseru toi | Capsule toys |
| 後継機(こうけいき) | kōkei-ki | Successor model |
| 株式分割(かぶしきぶんかつ) | kabushiki bunkatsu | Stock split. FURYU conducted a three-for-one split in 2017; prices must be adjusted before comparison |
| マネジメント・バイアウト | manejimento baiauto | MBO, or management buyout. This was how FURYU became independent of OMRON in 2007 |
---
## The following is the record first published in September 2022. It reflects the market structure at that time; the original text has been preserved in full without deletions or revisions.
## (Original title) The Top Player Holding 90% of Japan’s Photo Booth Market: An Introduction to Tokyo-Listed Furyu Inc.
### Joe’s August 2026 addition
Want to know [how to find photo booths in Japan, operate them on-site, and get the photos onto your phone afterward? Read “A Guide to Japanese Photo Booths(プリクラ).”](https://photobooth.joelin.cc/guide/japan-photobooth/)
(August 2026 addendum) The article’s “FURYU has 94% market share” refers to a 2021 survey.
From July 2025, SEGA, currently operated by セガ フェイブ, returned to this market with the NICO MAKE series. Its five models currently in operation are cherrit, NICO MAKE, totolu, romakyun, and lalamee. The market share structure now differs from that of 2021.
→ Correction: The return date of “July 2025” in this addendum is incorrect. SEGA actually reentered in October 2020 with fiz. NICO MAKE, launched in July 2025, is GIMMI’s successor. See Section 6 above for details.
## Furyu’s business categories: Girls’ Trend Business and Worldview Business
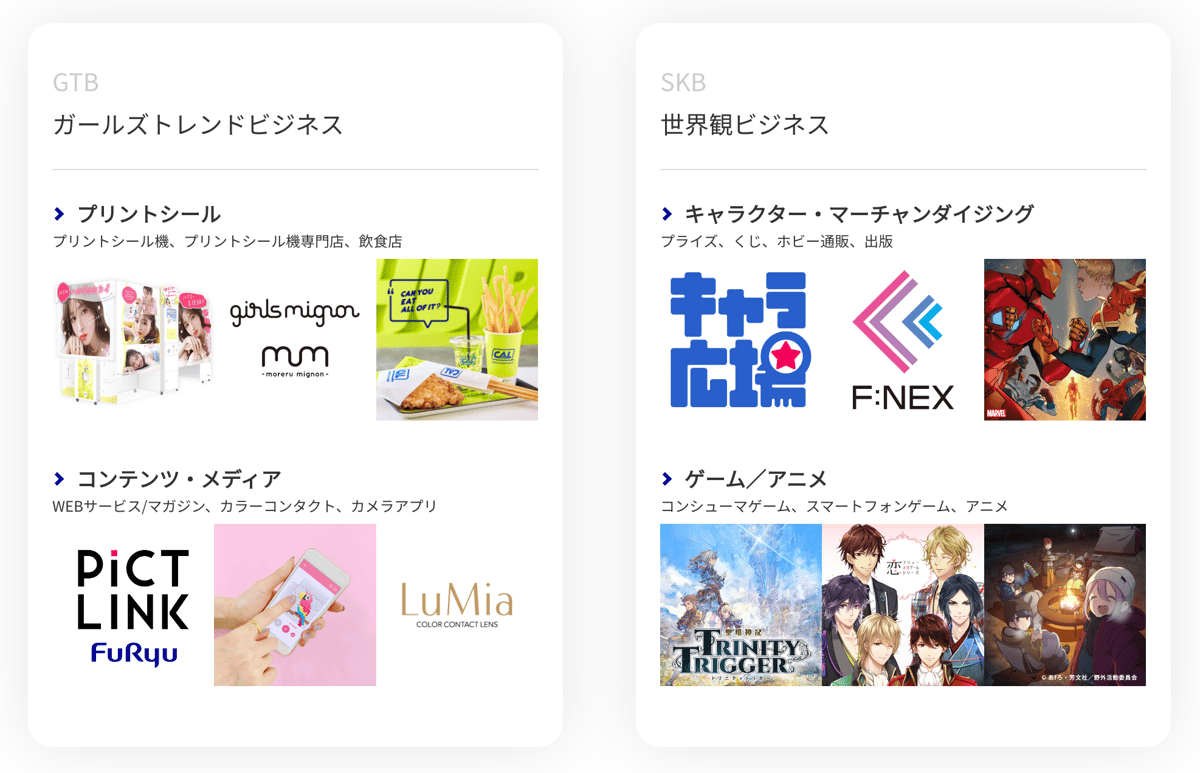
A client’s needs prompted this research into the “girls’ business”: the products and services offered to teenage girls as the target customers.
## The position of Furyu’s Girls’ Trend Business in Japan
According to a 2021 survey, Furyu’s photo booth stores and machines account for 94% of the Japanese market.
### Furyu Girls’ Trend Business website
## What businesses fall under Furyu’s Girls’ Trend Business?
There are four main business areas:
- プリントシール機: sticker photo booth machines.
- プリントシール機専門店: specialist sticker photo booth stores.
- 飲食店: food and beverage establishments.
- ガールズ総合研究所: a research institute focused on girls.
Here is a quick Japanese lesson.
プリントシール
This term combines two phonetic components: プリント and シール.
プリント = Print, pronounced Purinto.
シール = Seal, pronounced shīru.
Together, they mean a printed, adhesive sticker.
### The photo booth business(プリントシール機)
The photo booth business primarily develops machines for female high school and university students.
It uses data and scientific analysis to create innovative products that lead trends.
The company’s official news page:
See the images below for examples of the machines.










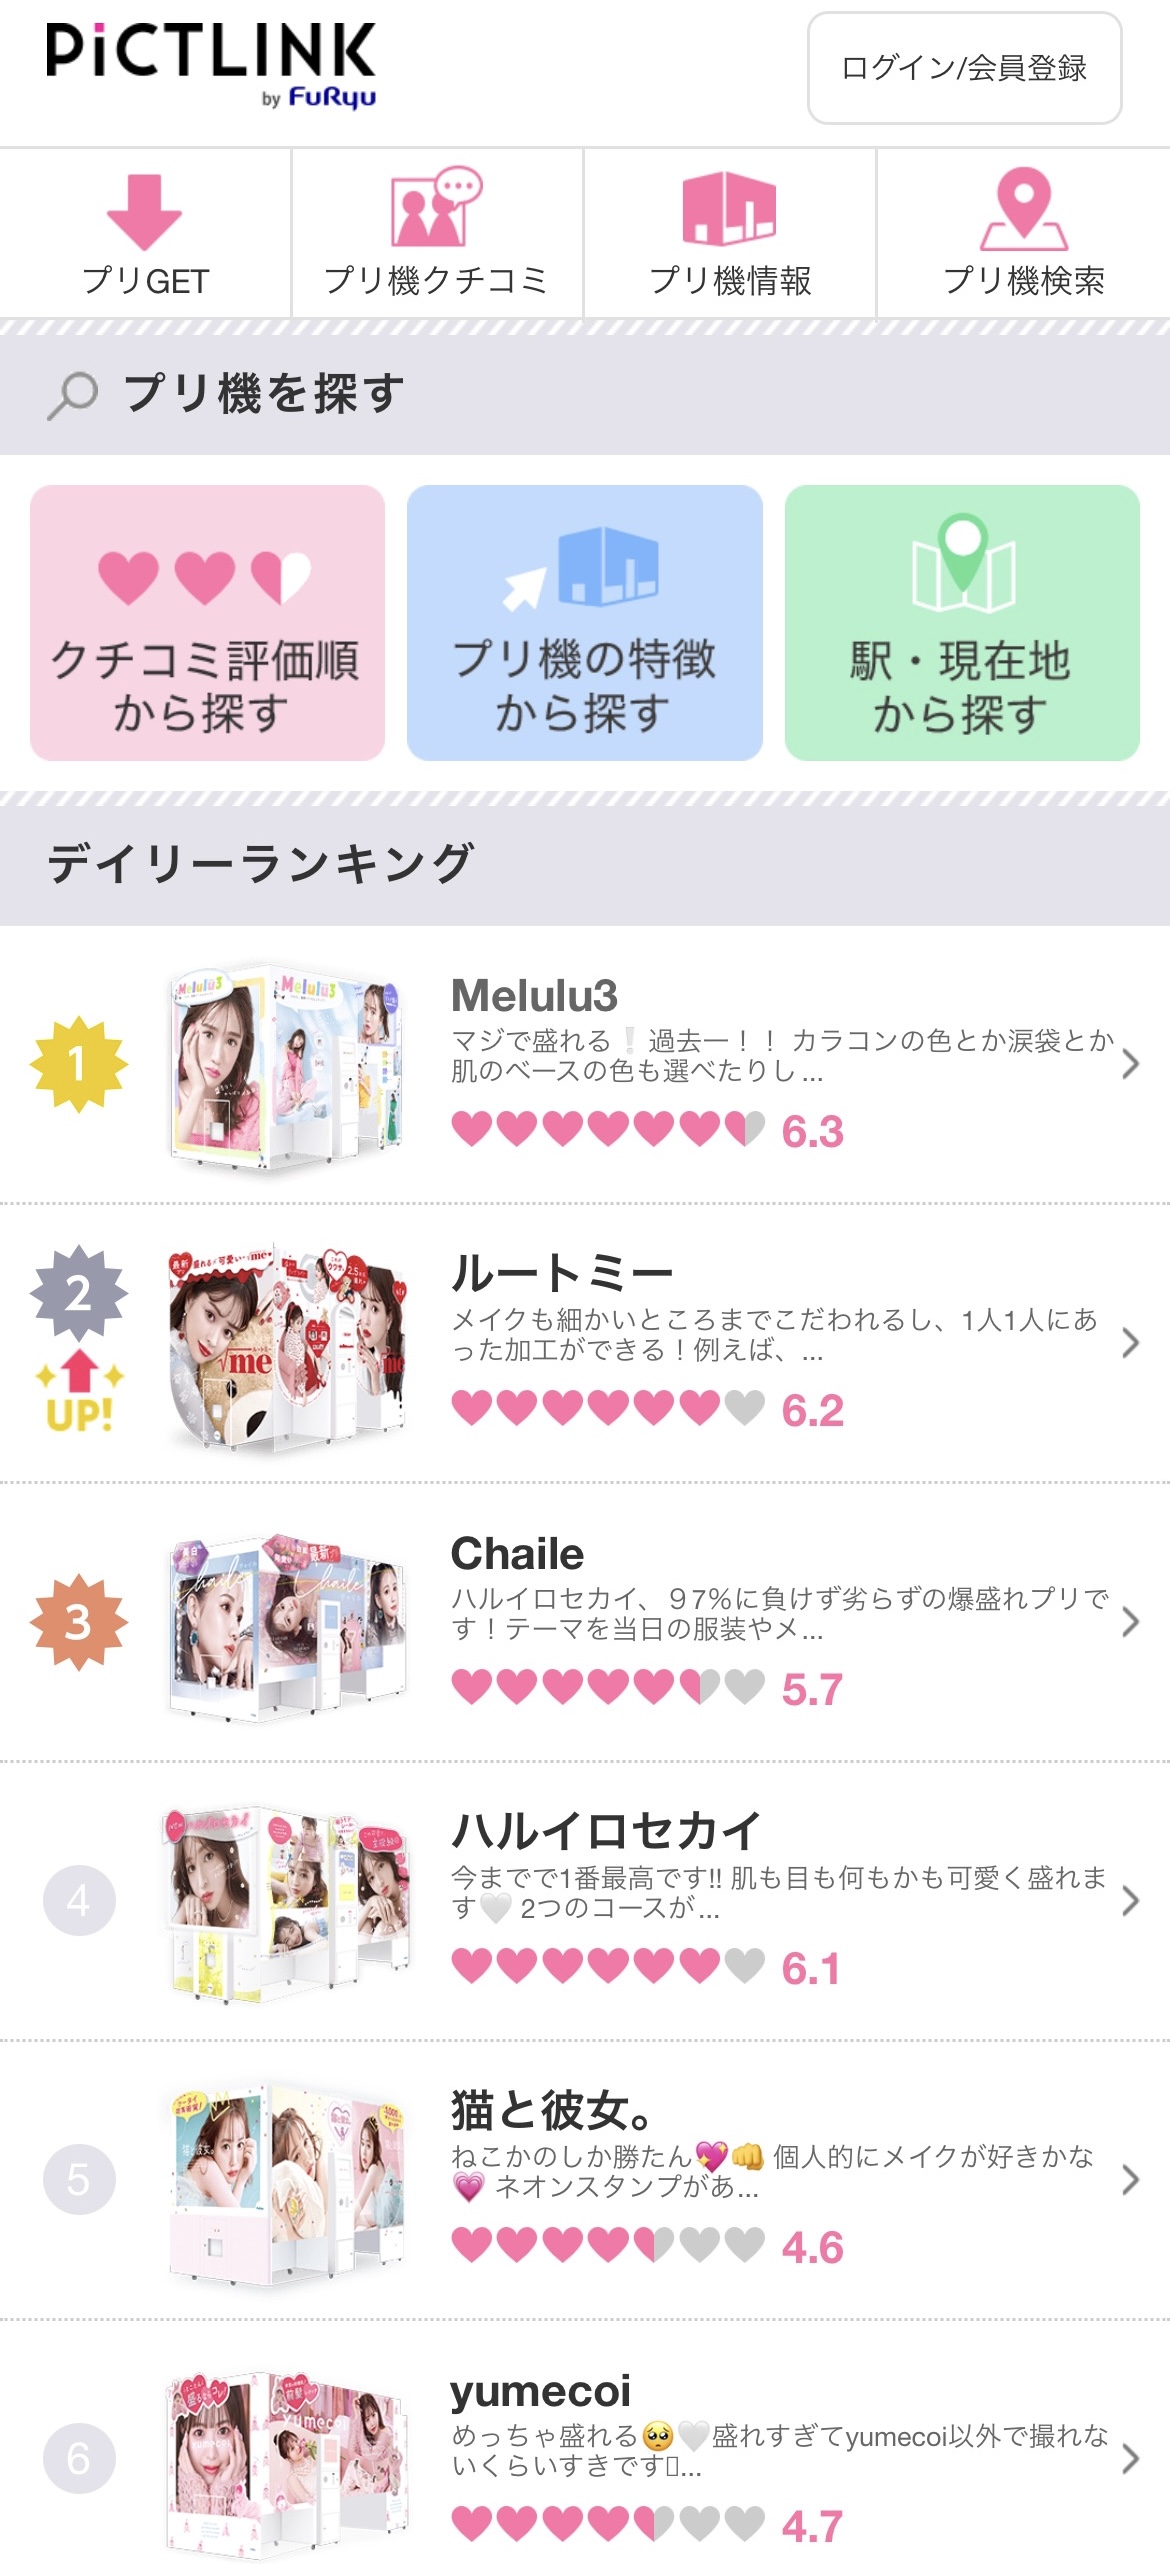
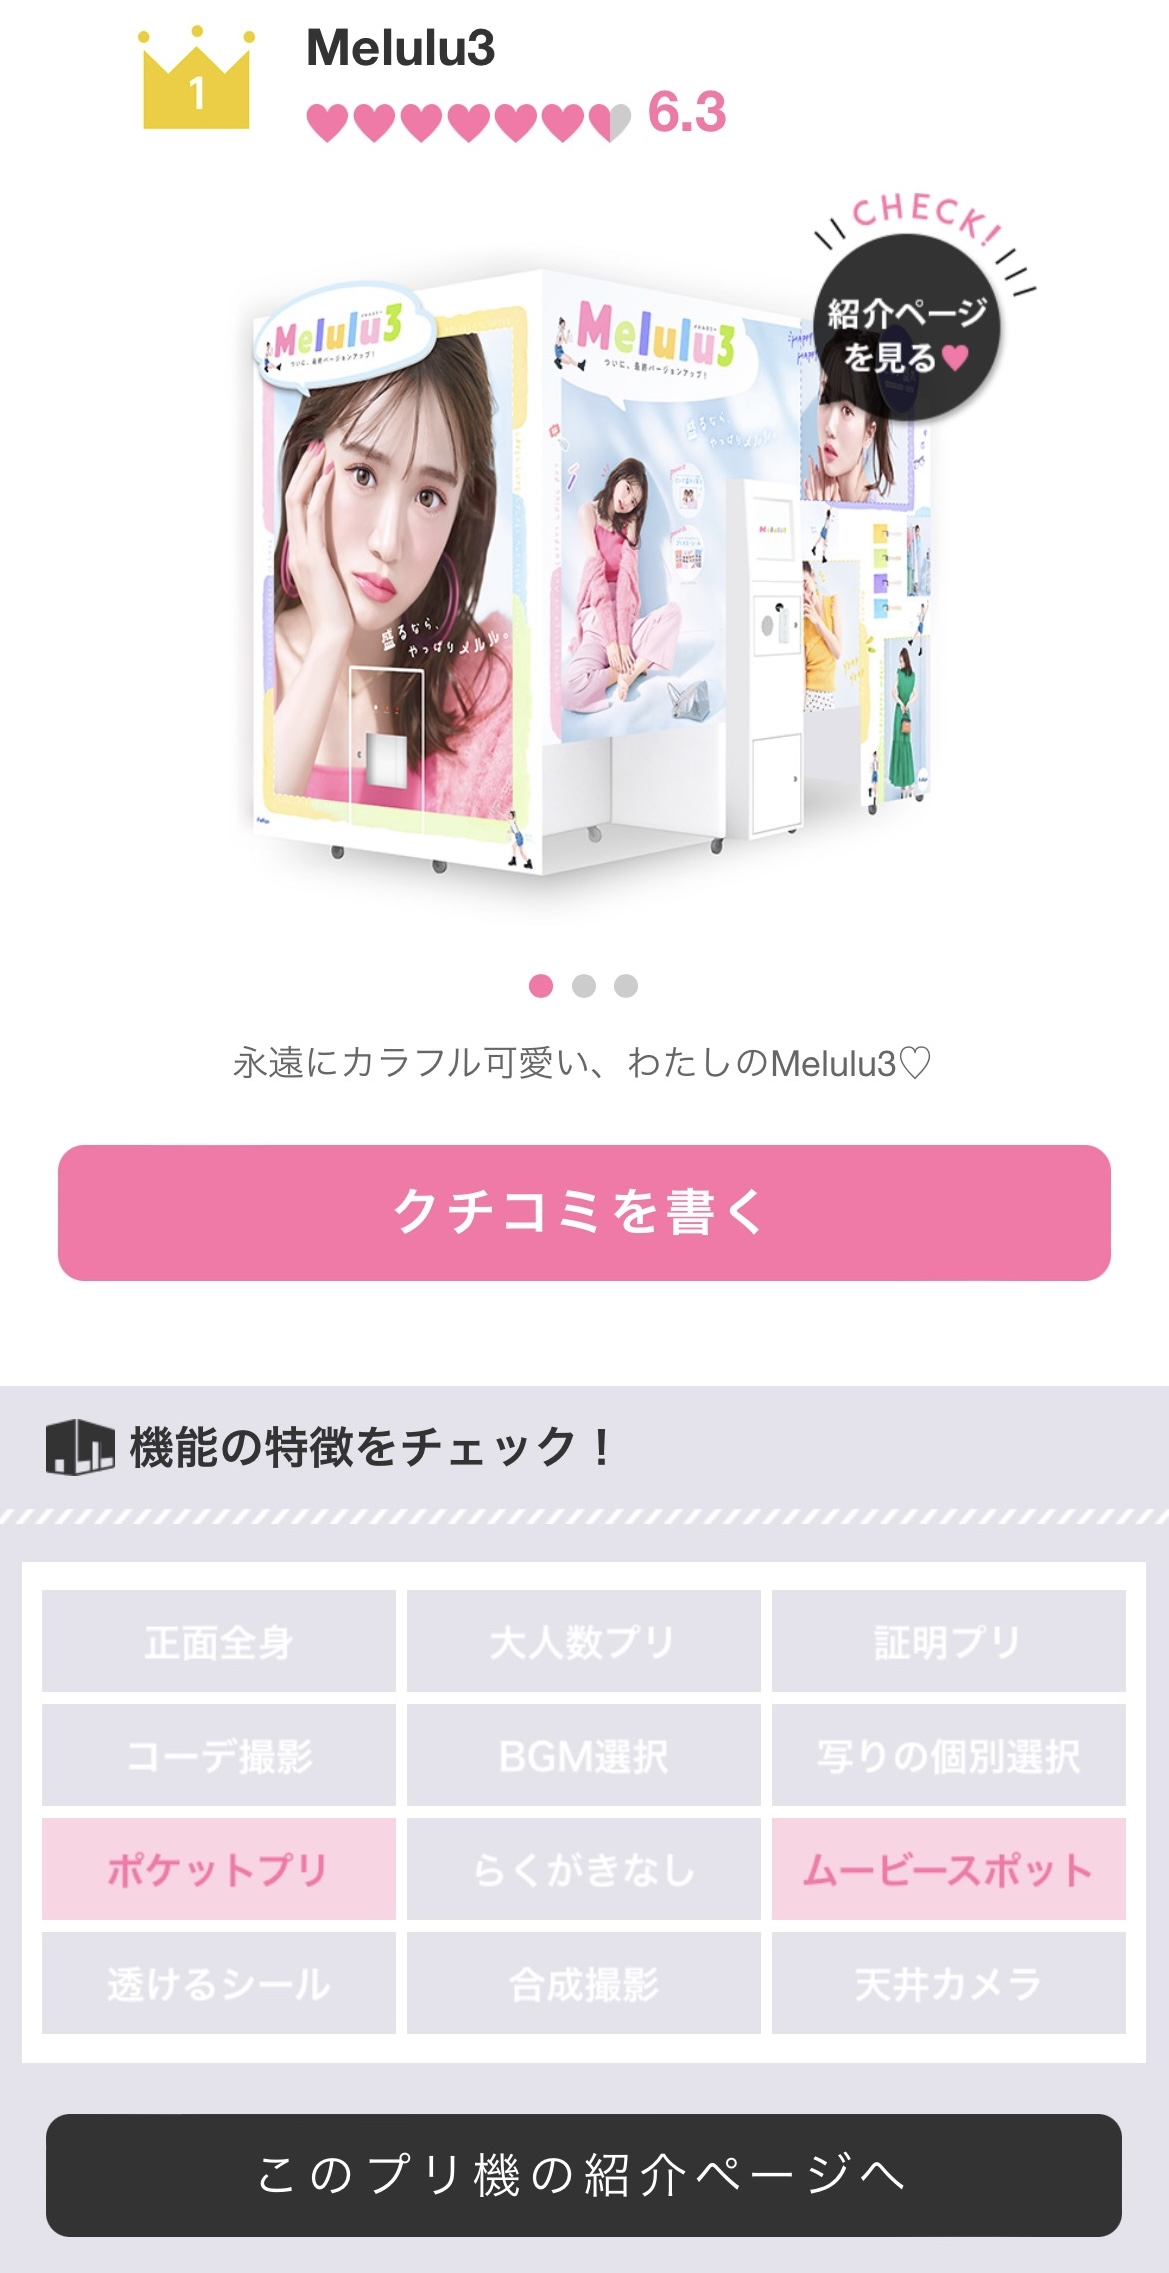
#### Which photo booth machine is the most popular?
What is trending, and which machines are popular? Furyu provides a ranking.
Popularity ranking:
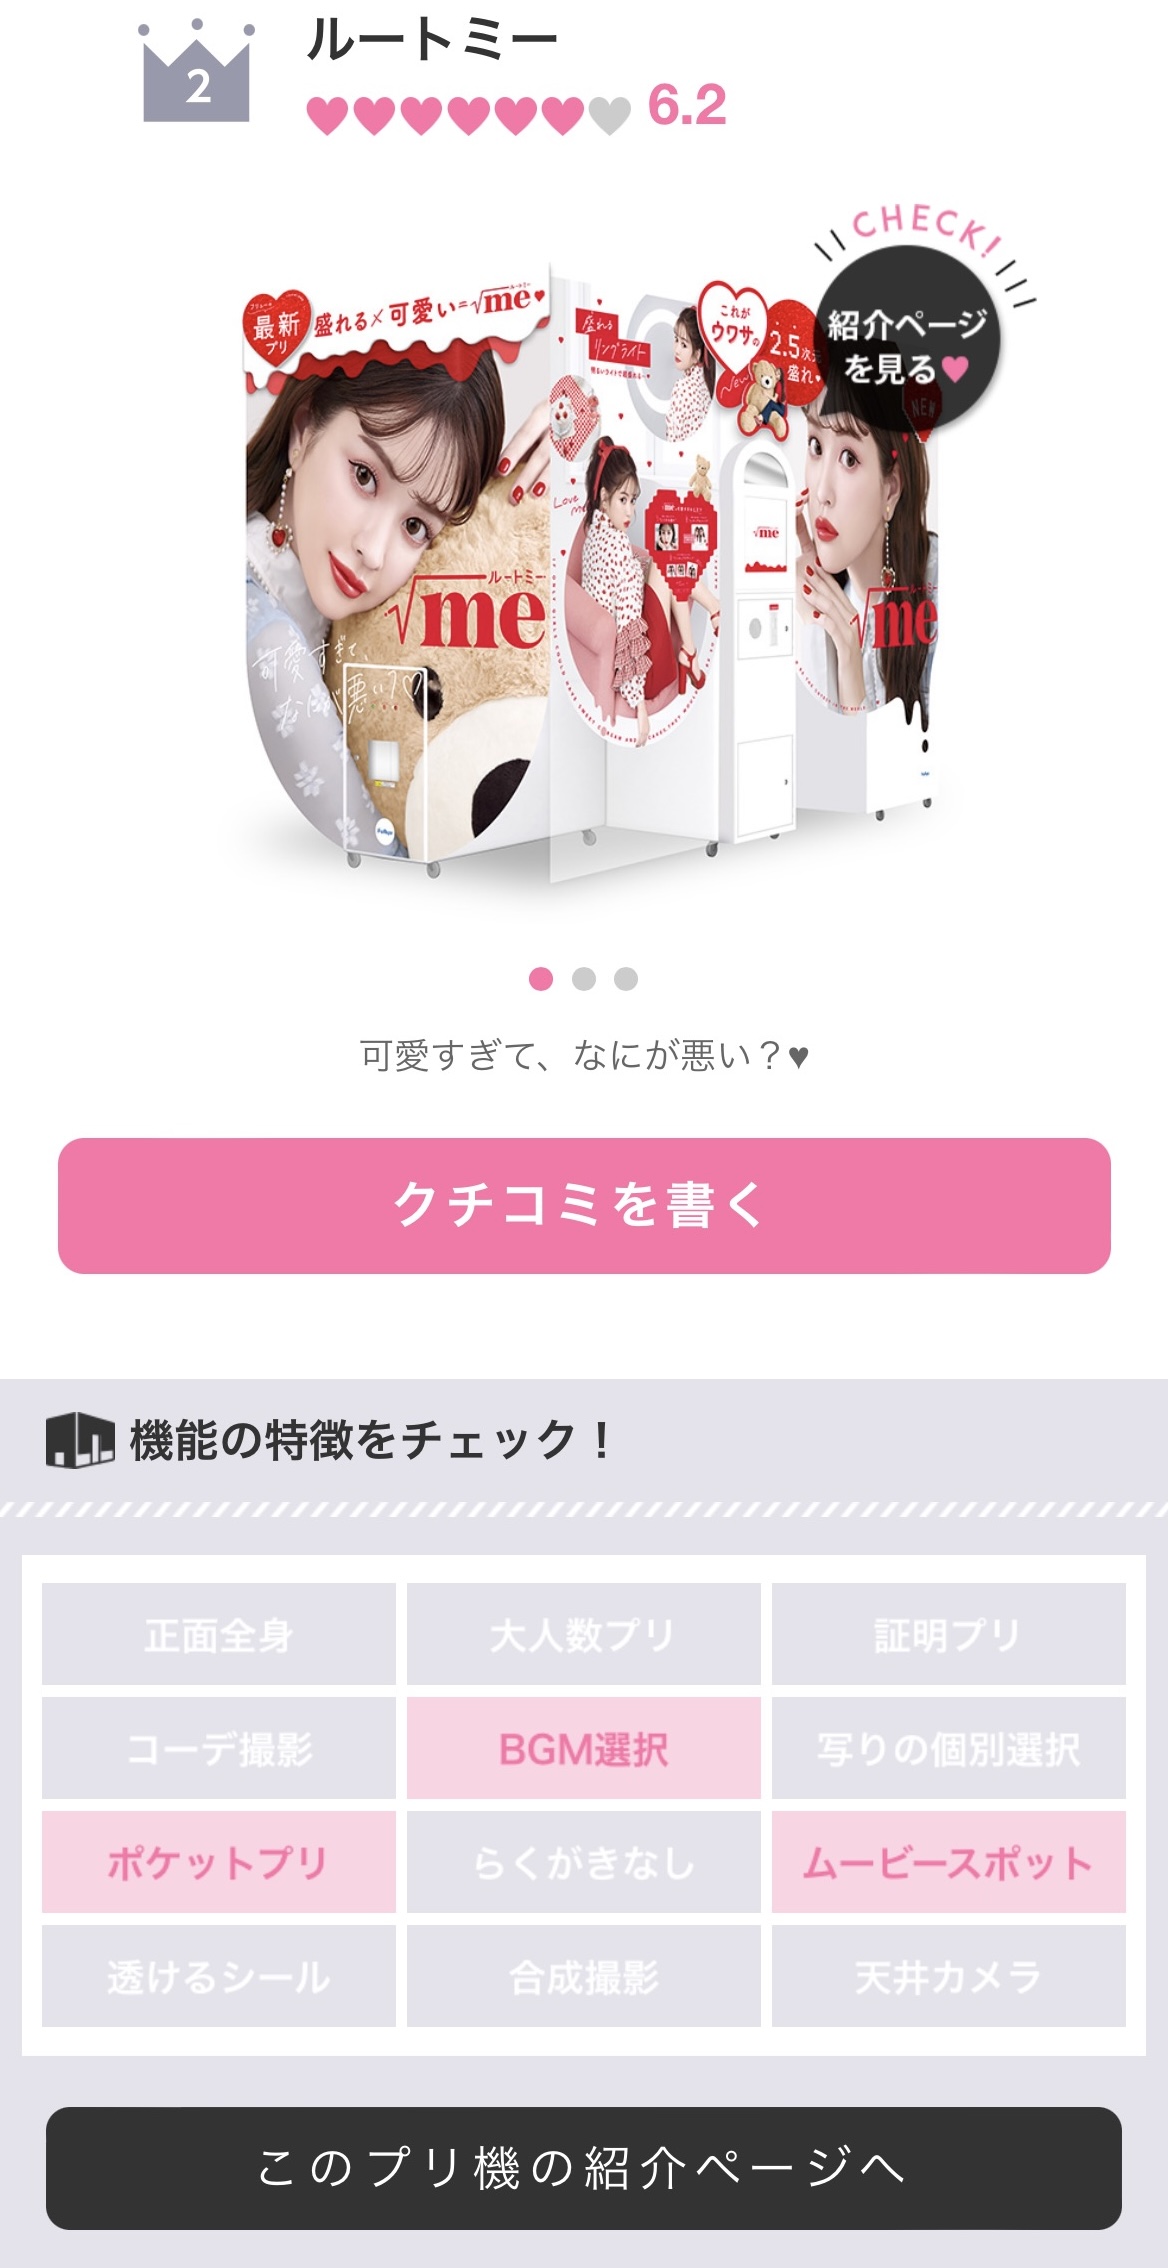
Each machine also has an overview of its features.
#### Historical machine catalog for the photo booth business(プリントシール機)
This is especially interesting: the official site documents all historical machines from 2005 to the present.
Official historical information:

#### Photo booth press releases and product feature descriptions
Furyu issues a press release explaining the features whenever a machine launches.
Here is an example:
All press releases can be found here:
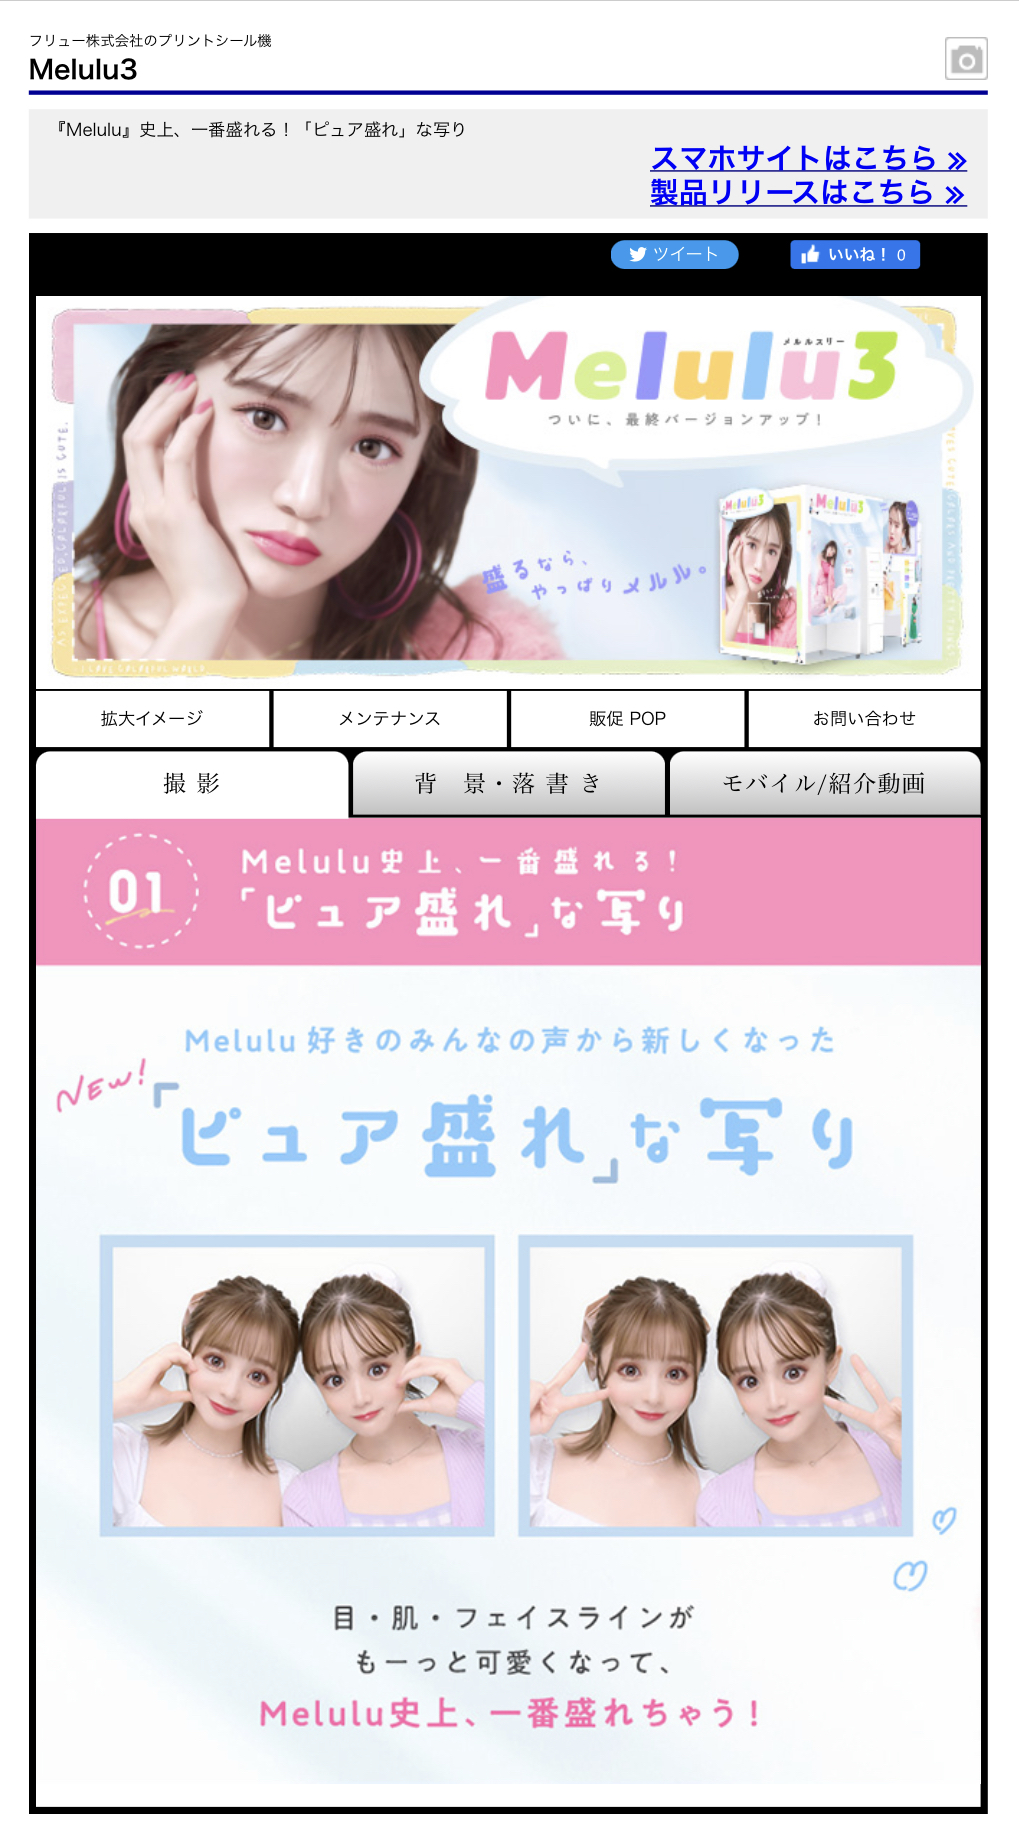
Each product also has its own explanatory page.
Melulu3 photo booth product page:
Product information page:

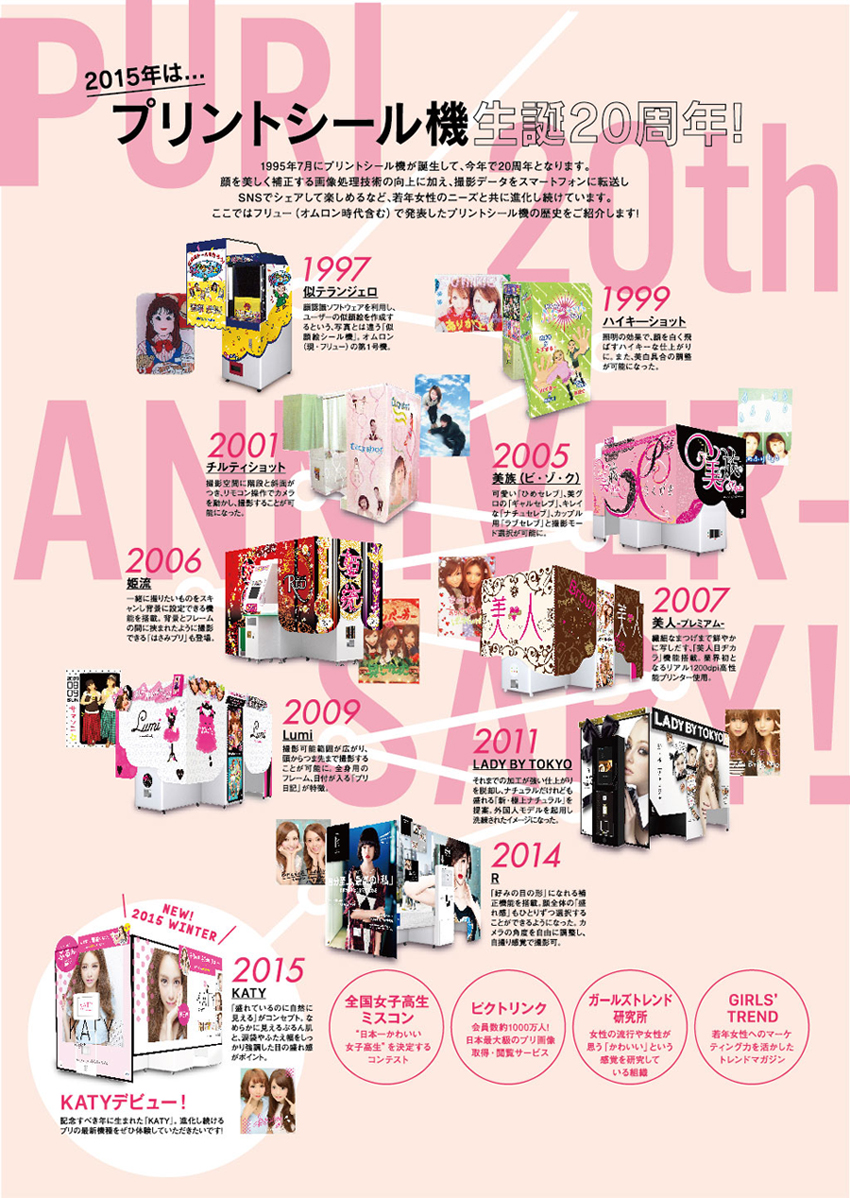
#### Special coverage of the photo booth’s 20th anniversary
From Furyu’s entry into the photo booth market in 1995 to 2015, the history spans 20 years.
The official site has a special feature with media coverage and data research. See:
### Specialist photo booth stores Mignon(プリントシール機専門店), further divided into the Girls mignon and Moreru mignon brands
Further research pending.
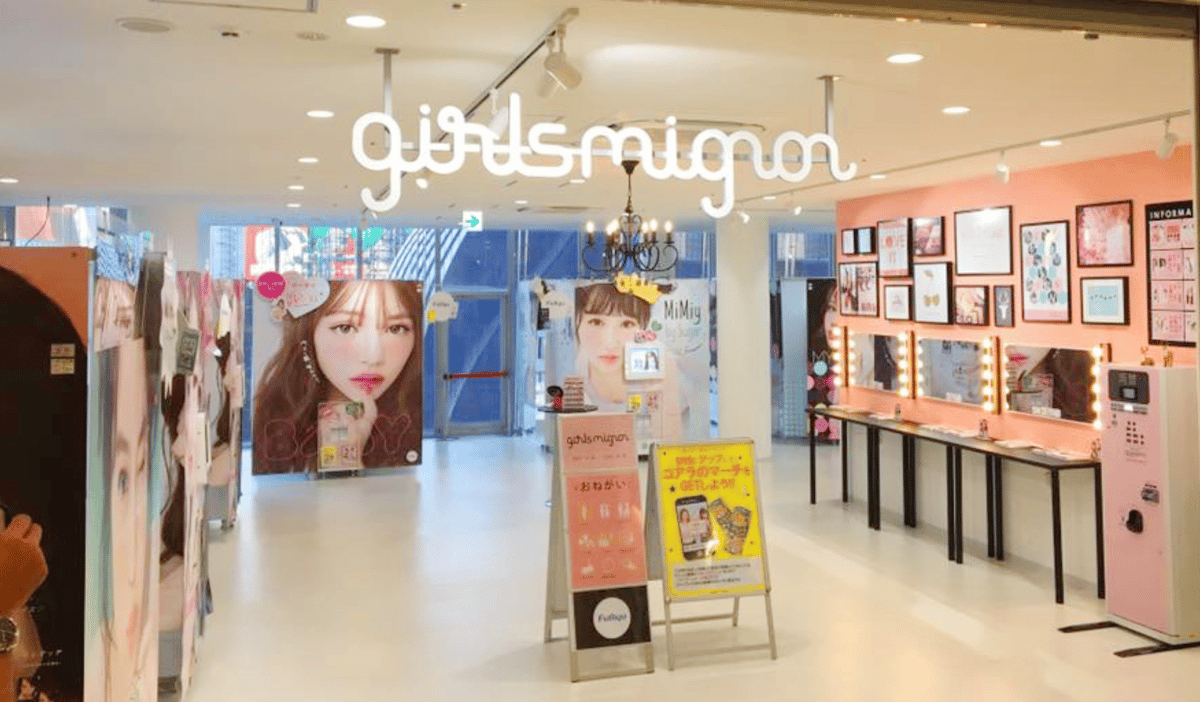
Girls mignon is positioned as a photo booth store.
Moreru mignon is positioned as a cute location-photo venue?
#### Girls mignon: Photo booth stores for teenage girls
As of September 2022, Girls mignon has 29 stores.
Official website:
The current popular style makes eyes so large they look alien.
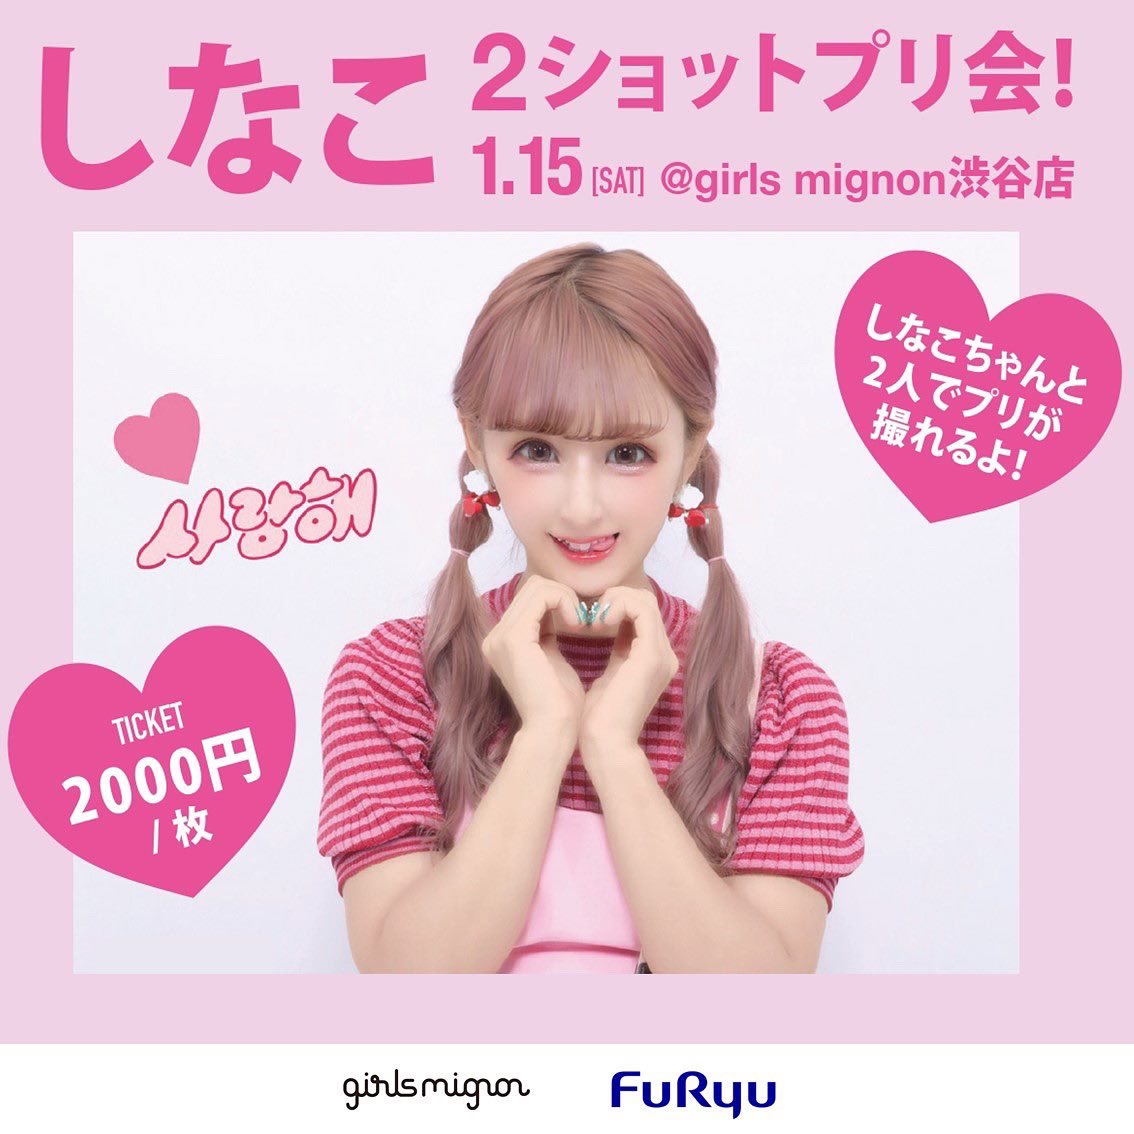

##### Examples of Girls mignon’s cross-industry brand collaborations
###### A collaboration with contact lenses



A collaboration post for Girl mignon × Mewshop.

###### IP collaborations

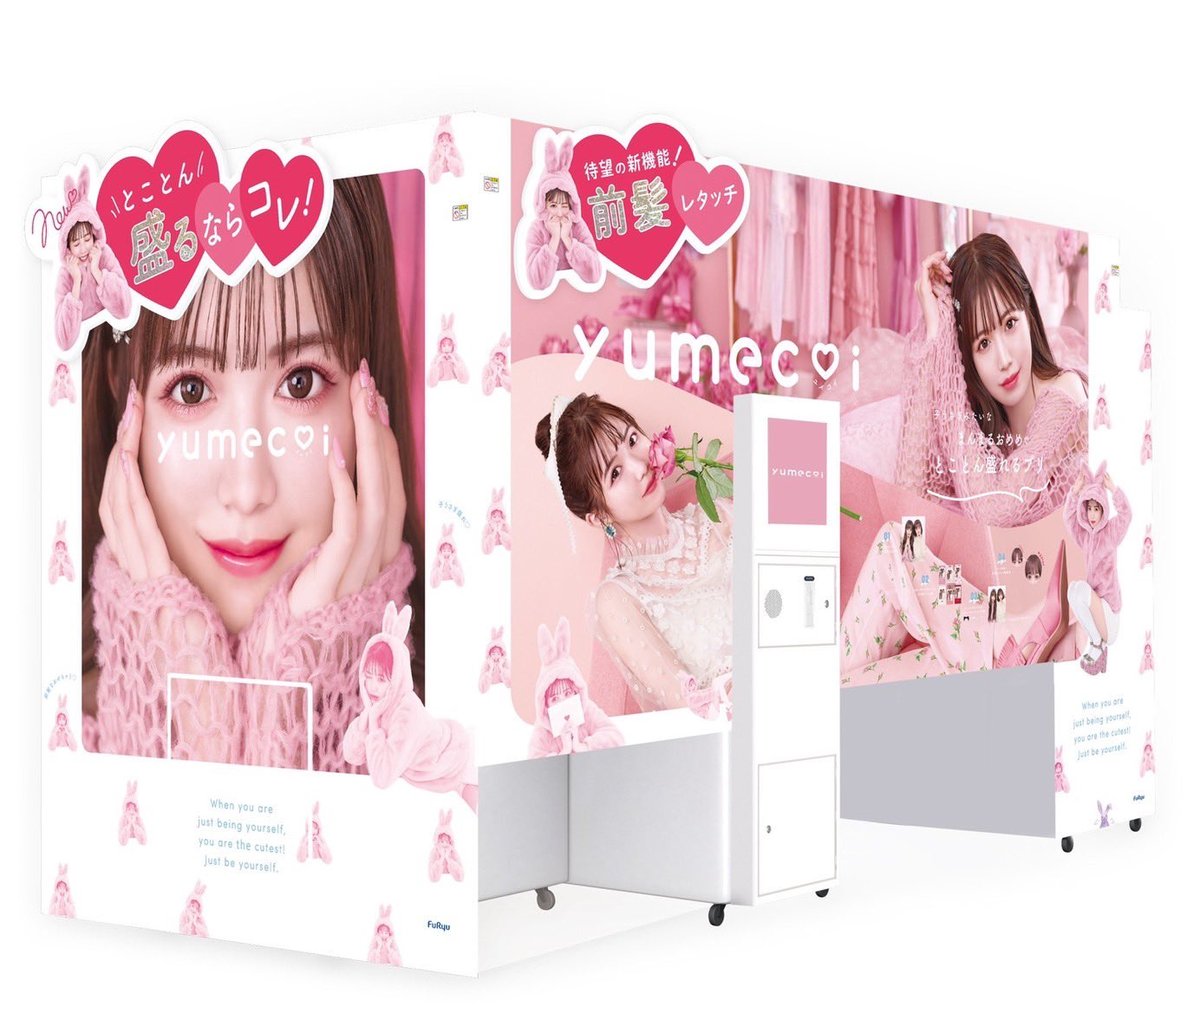
#### Moreru mignon
An elaborate, pink, cute photo booth store.
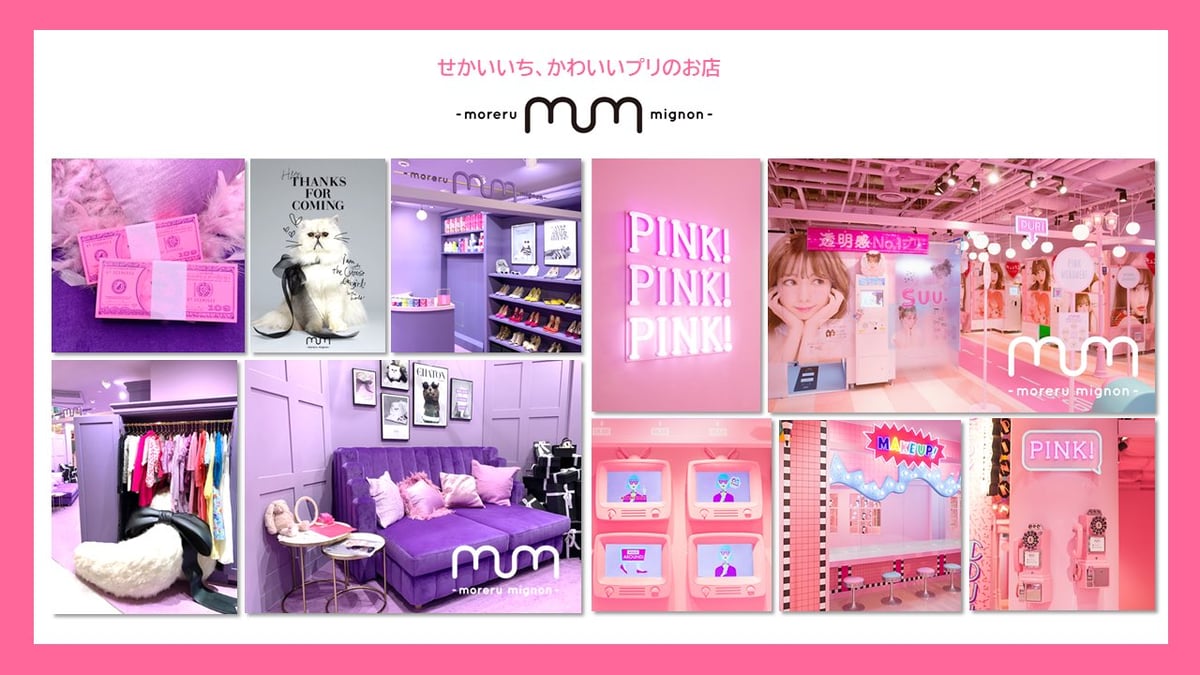
Official website:
#### Social media for Mignon photo booth stores
Twitter:

Instagram:
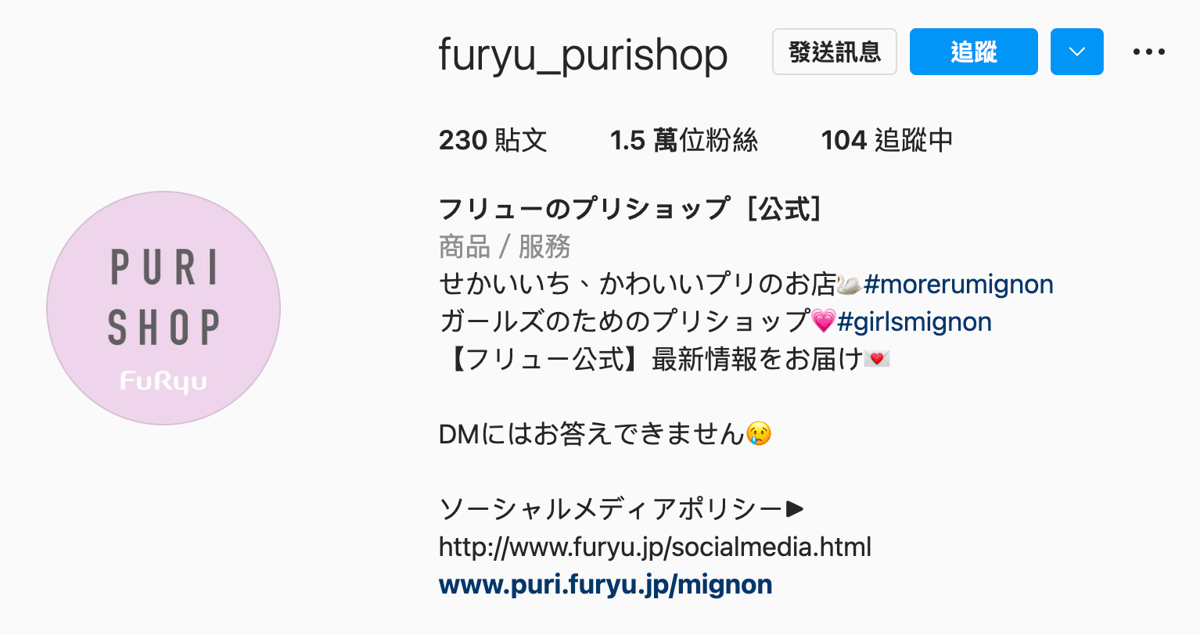
Instagram #girlsmignon:
Instagram #morerumignon:
### Joe’s 2024 store visit
[\[Okinawa\] Visiting girls mignon in Okinawa: A Store Operated by Japanese Photo Booth Giant Furyu Inc.](/p/5259)
I visited in September 2024.
### Food and beverage business(飲食店)
Further research pending.
### Furyu’s research institute studying teenage girls’ lives(ガールズ総合研究所)
A large part of Furyu’s business concerns women, particularly teenage girls.
ガールズ means “girls” and is pronounced Gāruzu.

Furyu’s institute provides research reports and marketing data about girls.
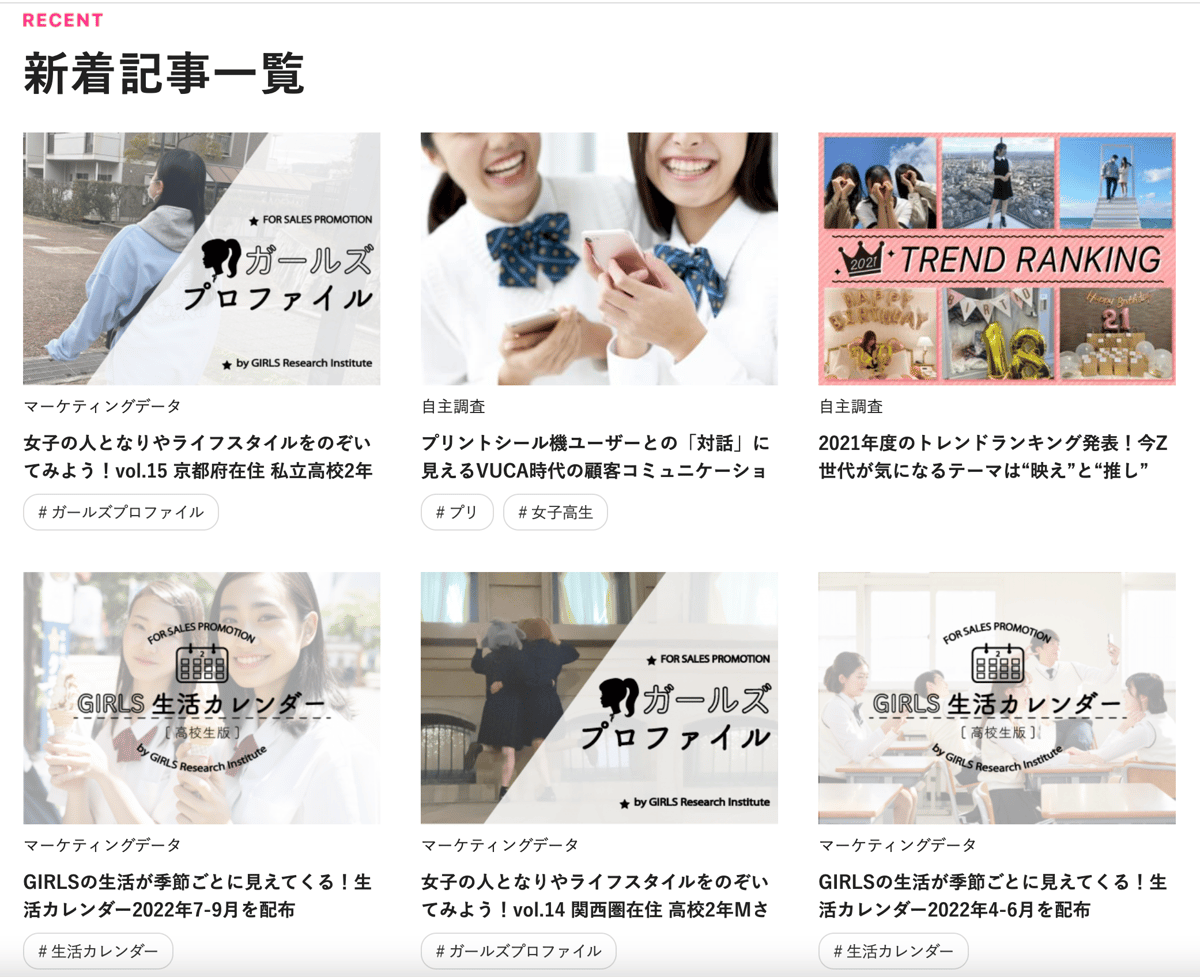
- Official website of Furyu’s girls’ research institute:
- Research on girls’ issues:
- Marketing data research:
## Analysis of Furyu’s business revenue structure
According to the official classification, online membership is an important component alongside photo booth hardware and venue operations.
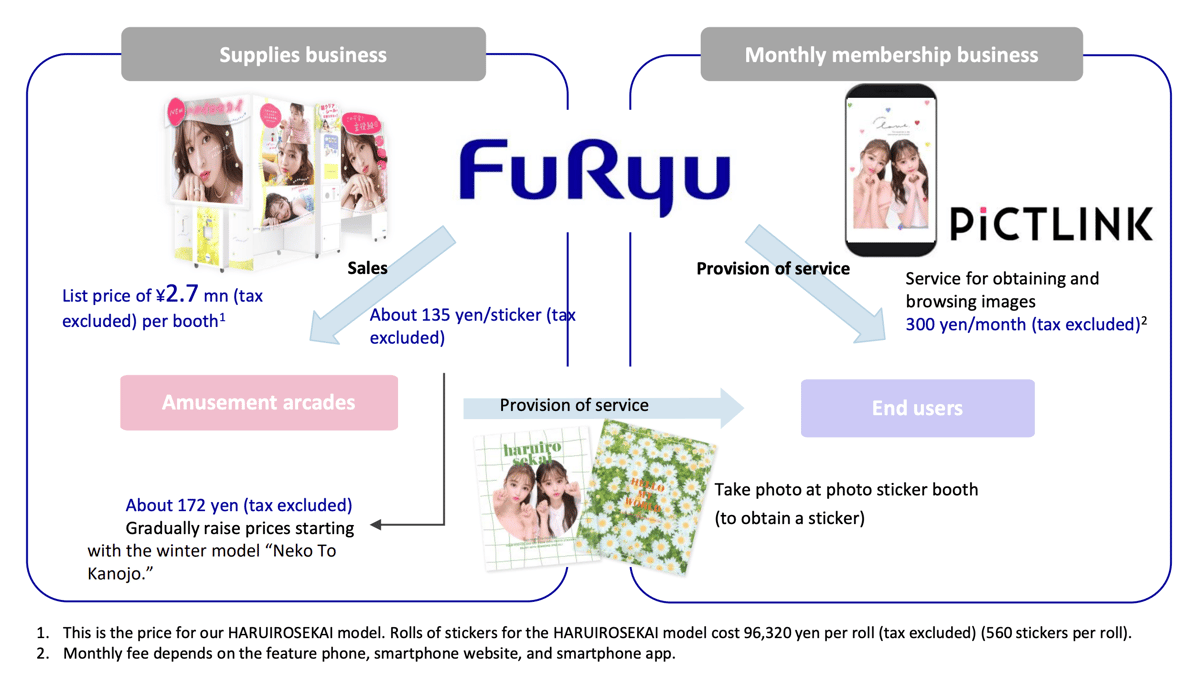
Revenue per machine is JPY 2.7 million, equivalent to approximately NTD 591,000.
Japan’s consumption tax is 10%, bringing the converted amount to approximately NTD 537,000.
That is approximately NTD 44,750 in monthly revenue.
Each sticker photo is priced at JPY 135, equivalent to NTD 29.6.
Online membership is priced at JPY 300, equivalent to NTD 65.7.
### Cloud business data
#### Total membership
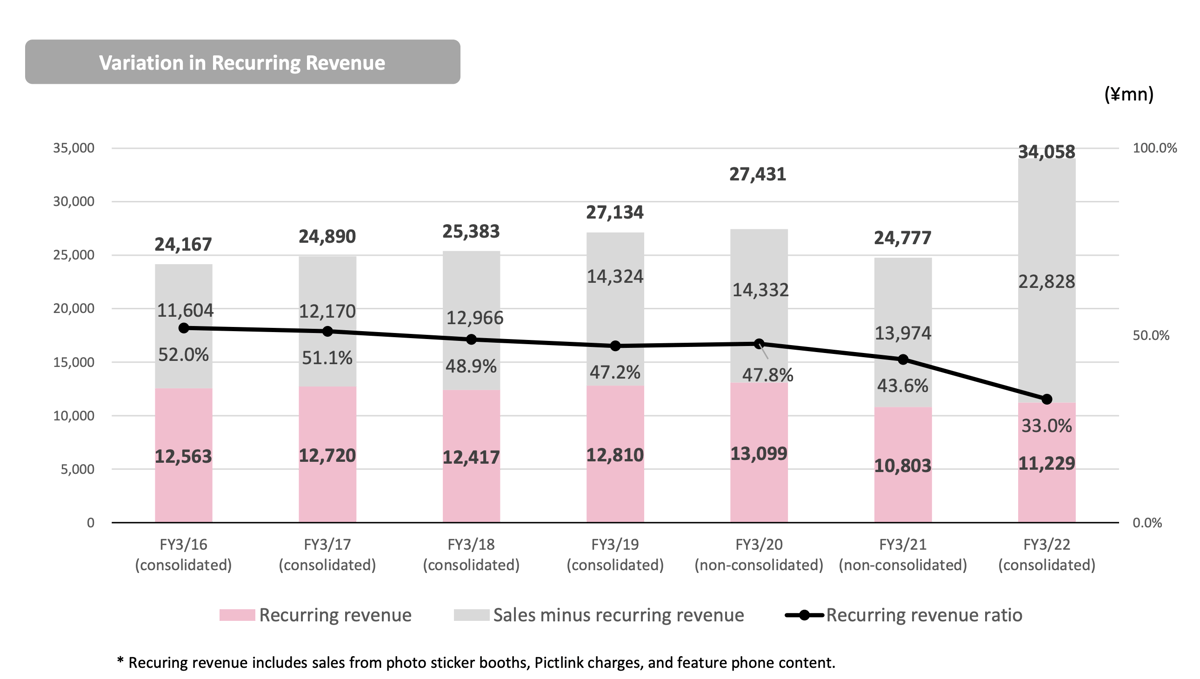
There are currently 22 million registered members, including everyone who has ever registered, both paid and nonpaid members.
#### Paid membership data
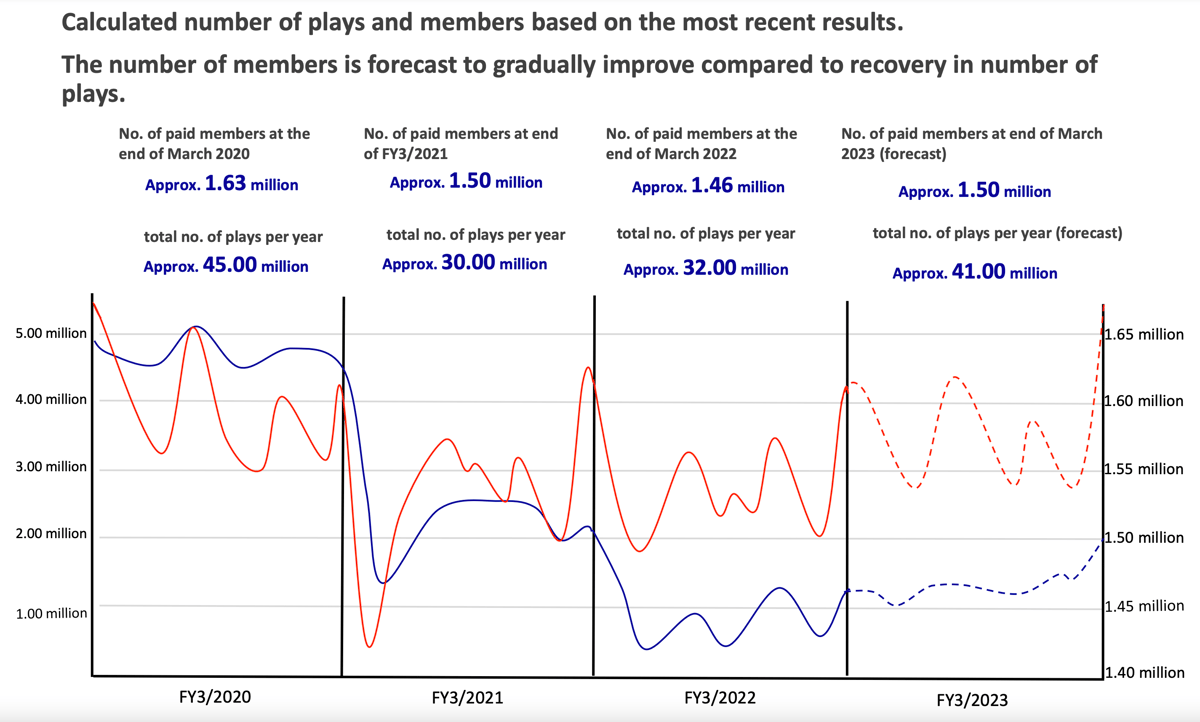
According to March 2022 data, there are currently 1.46 million paid members.
This paid membership count is roughly equivalent to the number of female high school students in Japan.
However, these paid members include people in their teens and twenties.
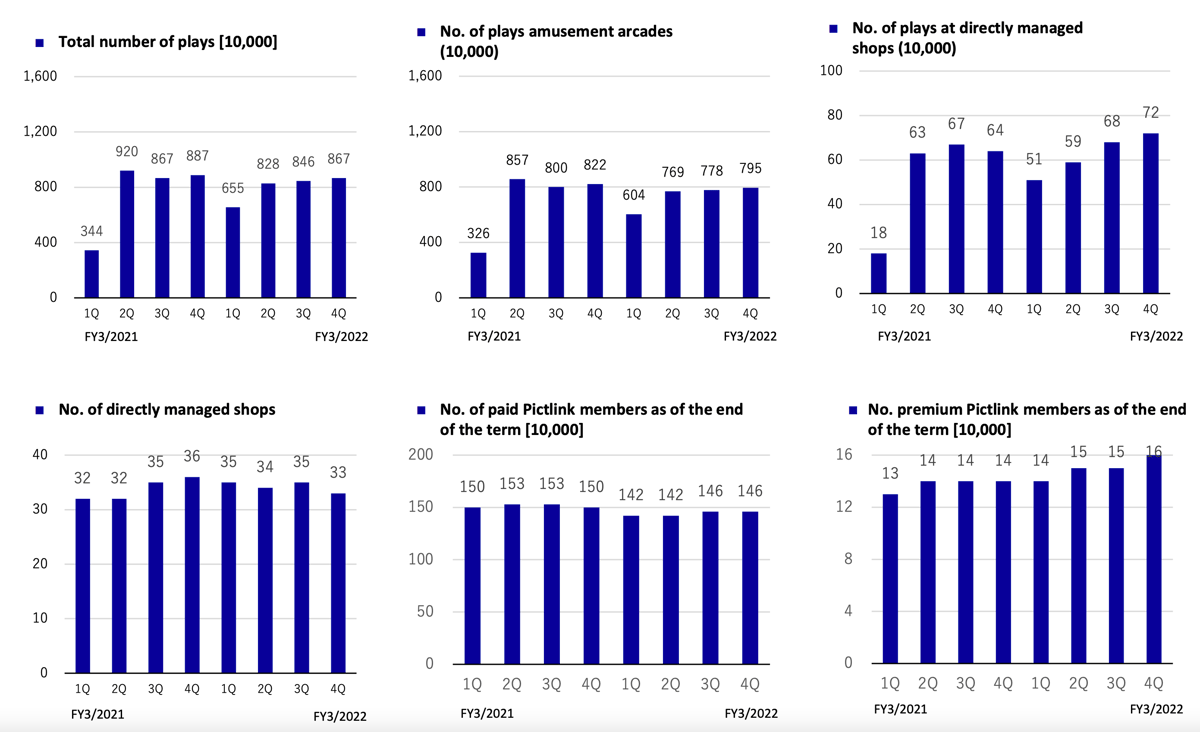
### Financial results of Furyu’s Girls’ Trend Business
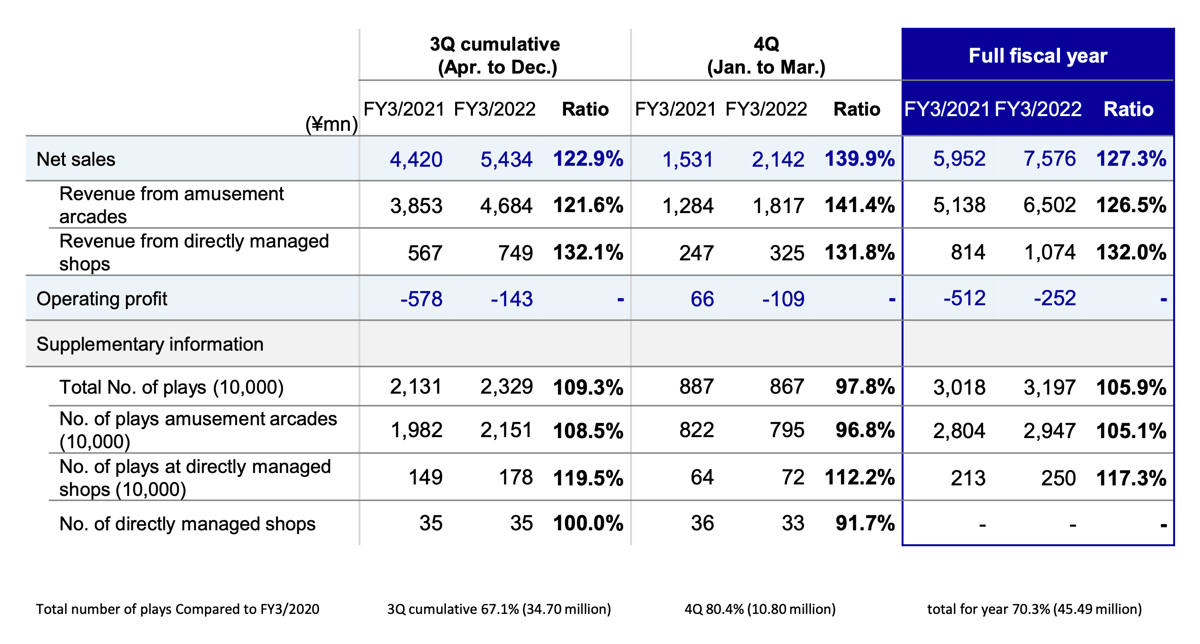
- There are 33 directly managed and operated stores.
- Directly managed and operated stores produced 720,000 outputs in Q1; in other words, 24,000 photos were output each month.
- Amusement arcades—arcades, franchisees, and so on?—produced 7,950,000 outputs in Q1, or 2,650,000 per month.
- Total Q1 output was 8,670,000 photos, or 2,890,000 per month.
### Furyu Girls’ Trend Business: Photo booth operating strategy
#### Photo booth operating strategy
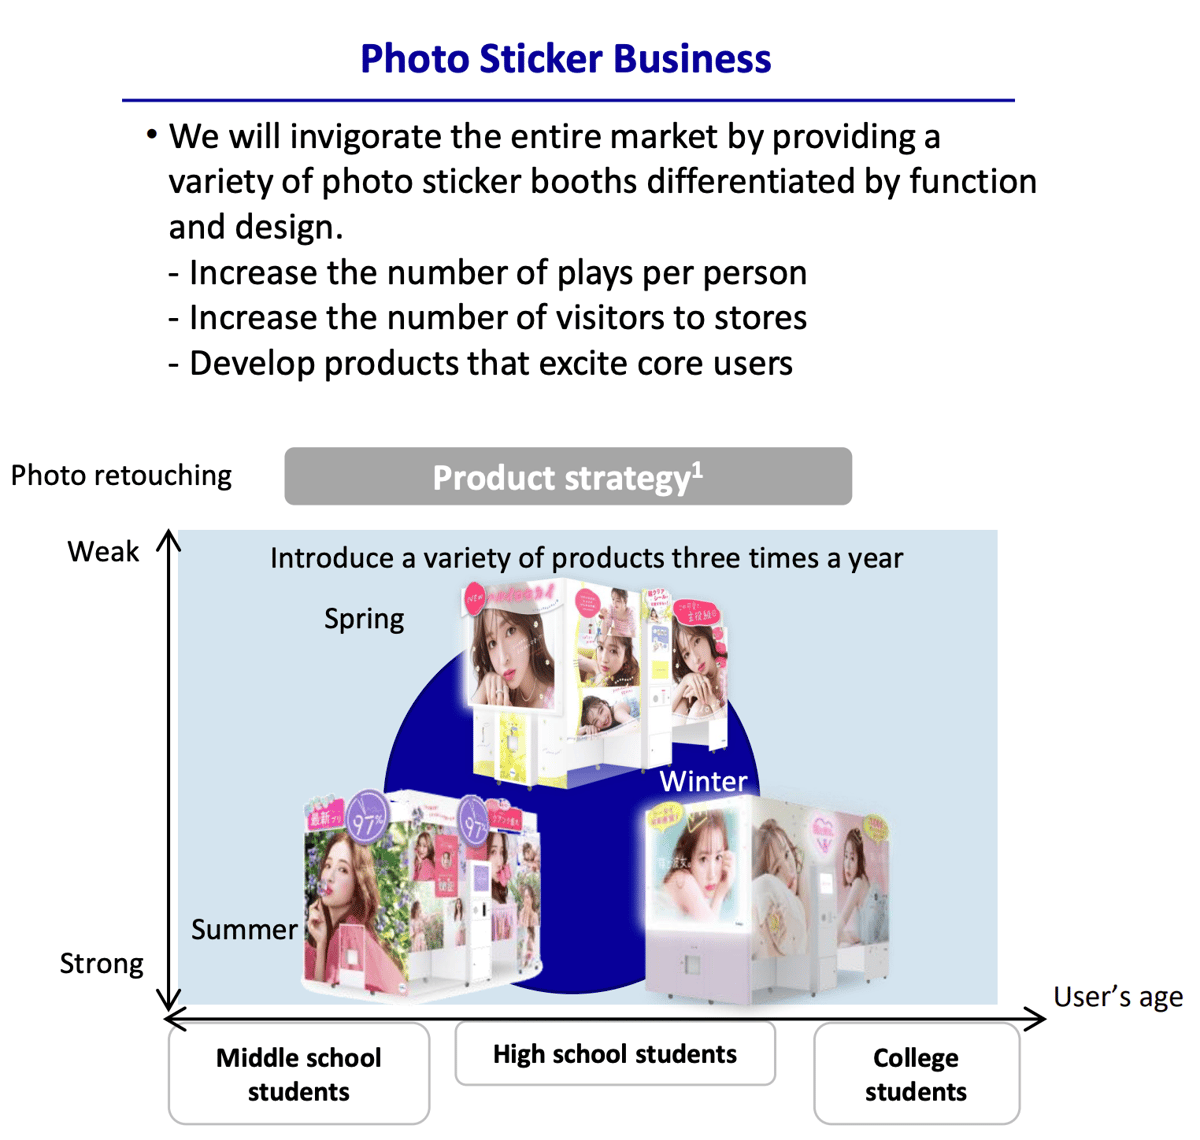
- Spring is the peak spending season.
- High school students are the most important customer group.
- The company aims to increase annual purchase frequency.
- It aims to increase annual store visits.
- It is developing medium-term member reward programs and products.
Core customers are:
- Junior high school students, ages 13–15.
- There were 3.218 million junior high school students in 2019.
- High school students, ages 15–18.
- There were 3.168 million high school students in 2019.
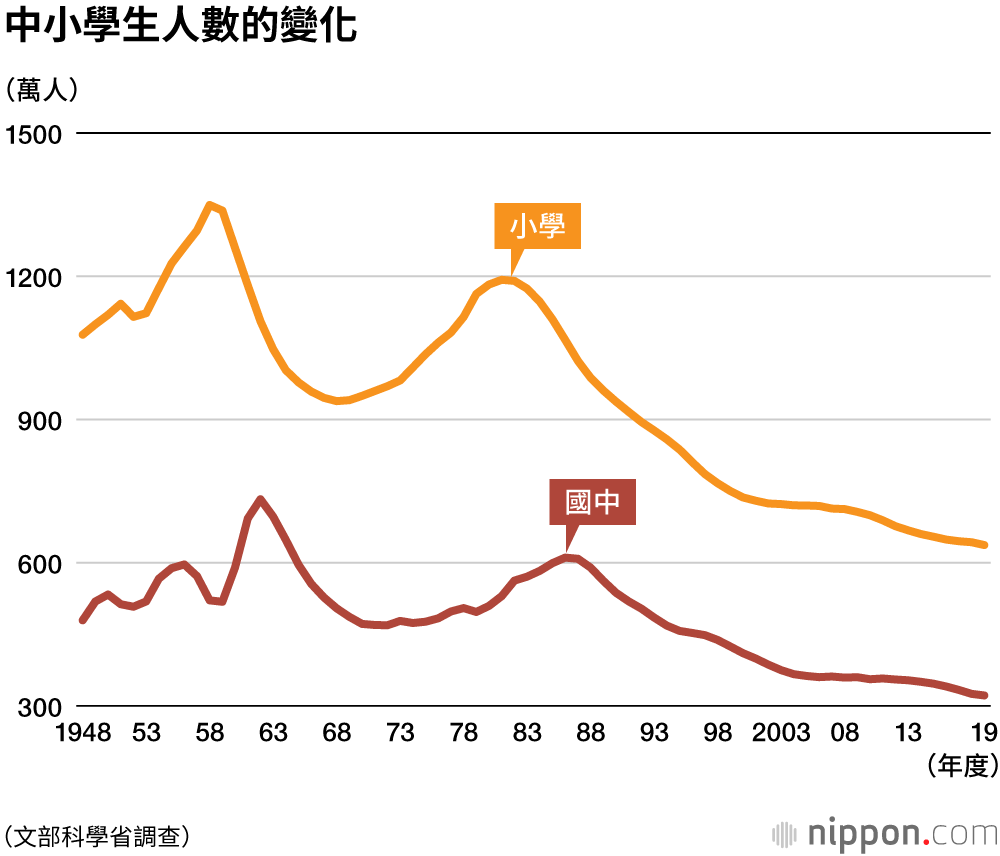
Of 1,112,070 junior high school graduates, 1,098,877 chose to continue into high school, a rate of 98.8%.
Meanwhile, of 1,051,246 high school graduates, 574,695 chose to enter university, accounting for 54.7%; 172,096 chose to enter specialized colleges, accounting for 16.4%; and 185,617 chose employment, accounting for 17.7%.
- University students, ages 18–22.
- There were 1.19 million female university students in 2021.
- There were 2.917 million university students in total in 2021.
#### Photo booth venue operating strategy
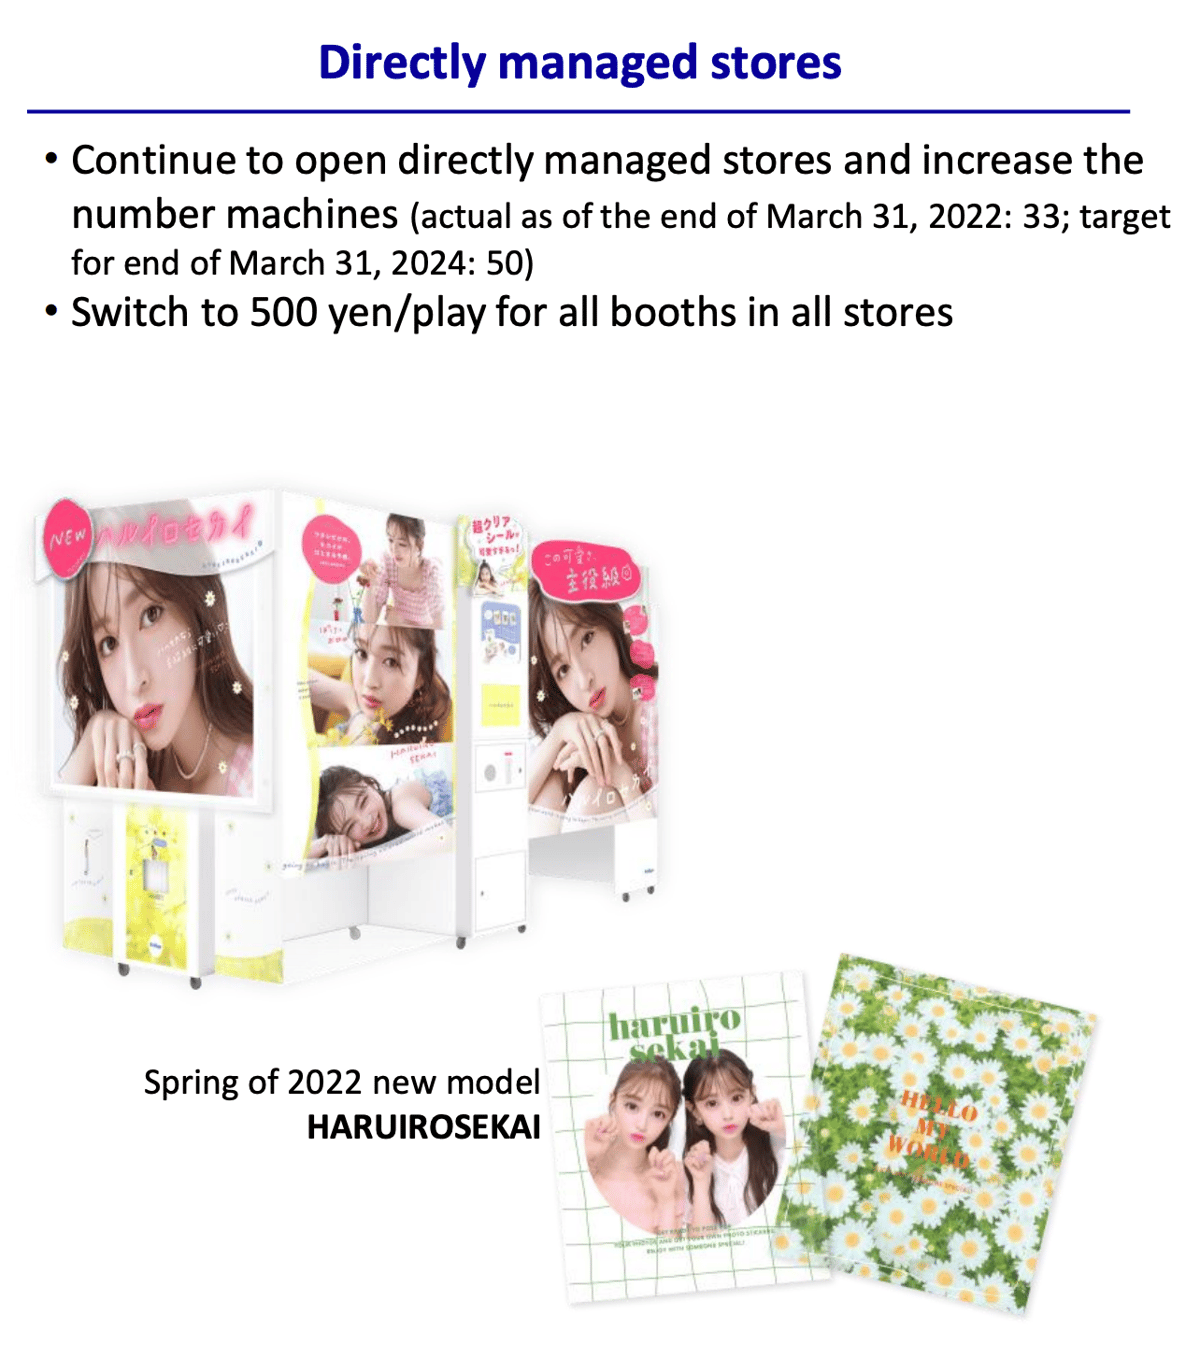
- Continue opening stores.
- Keep increasing spending per customer: currently 135 per session, with a target of 500 per session.
#### Forecasts for photo booth print volume and cloud services
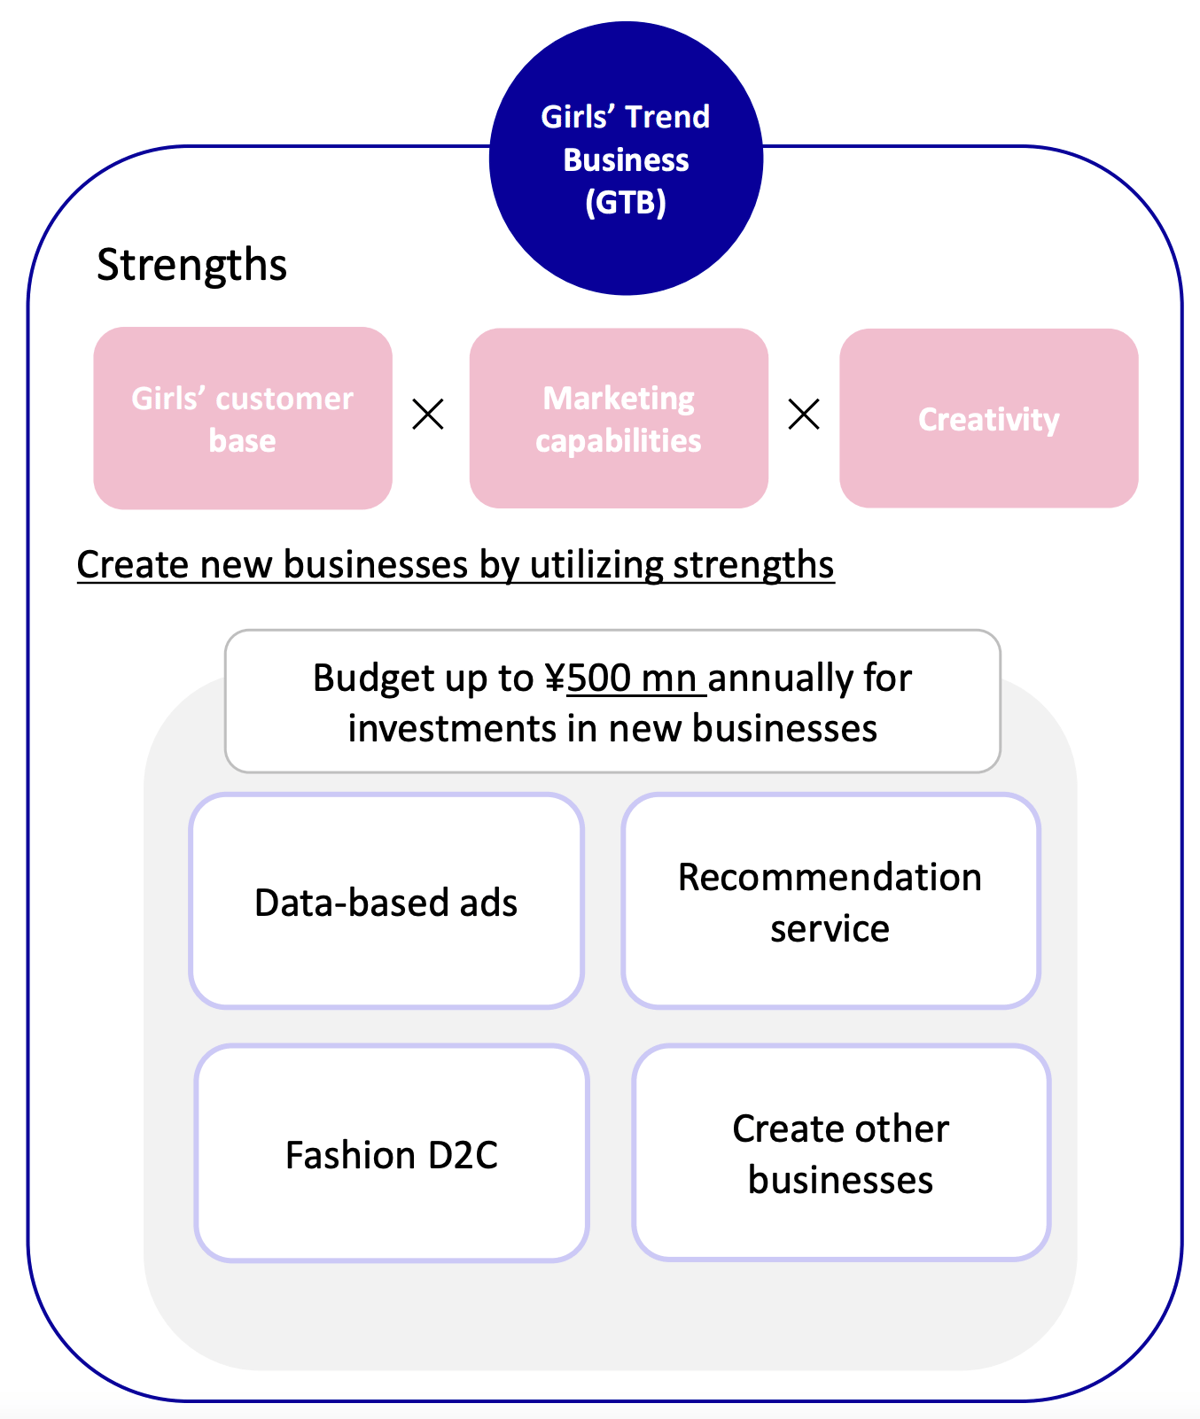
#### Future outlook for Furyu’s girls’ business
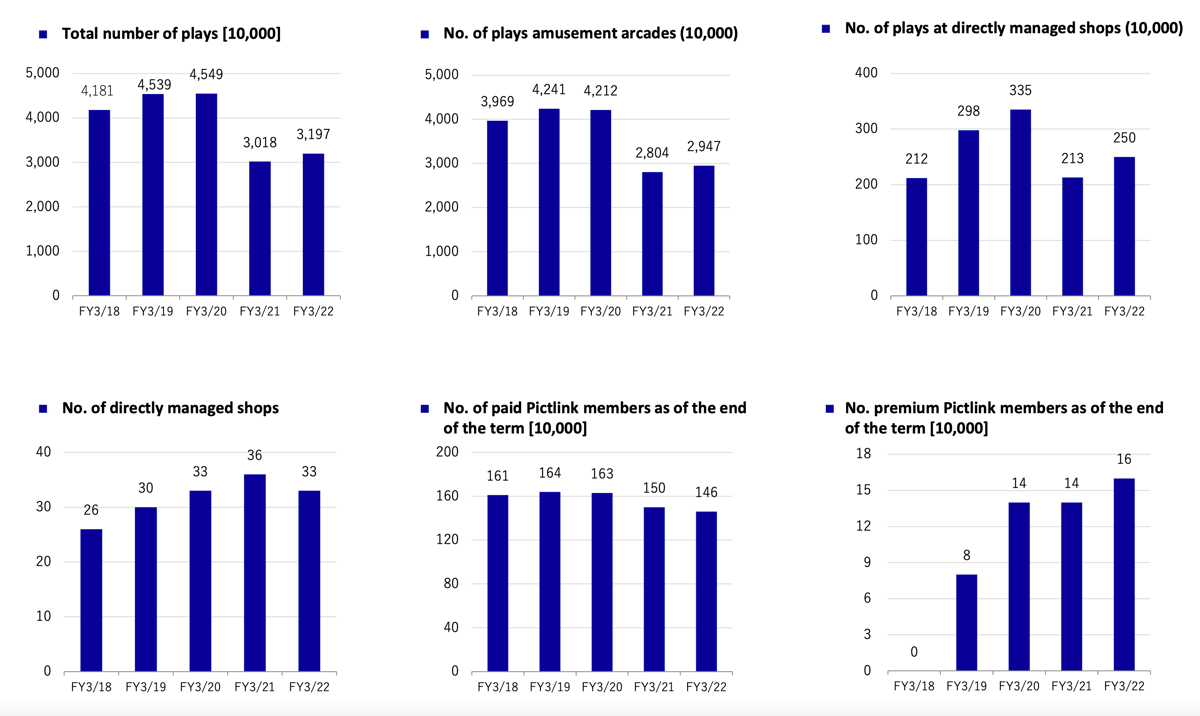
Core KPI data.
## Furyu’s company history
The information comes from the official website and differs slightly from Wikipedia. The official website takes precedence.
| Year/month | Milestone | Notes |
| --- | --- | --- |
| 1997/04 | OMRON’s entertainment business division | |
| 1998/04 | Entered the photo booth business | |
| 2001/12 | Entered the mobile content business | |
| 2002/01 | Began the amusement business | |
| 2007/04 | Became an independent company | |
| 2009/04 | Began the video game business | |
| 2012/04 | Acquired 100% of We’ve | |
| 2014/01 | Acquired shares in Coreedge Inc | |
| 2015/12 | Listed on the Tokyo Stock Exchange | |
| 2019/07 | Merged with We’ve Inc. | |
| 2019/11 | Sold all shares in Coreedge Inc. | |
| 2021/04 | Established the venture capital firm Olu. Inc jointly with Code Share Inc | |
| 2022/03 | Acquired all shares in Olu. Inc. | |
## Basic Japanese terms to learn when following Japan’s photo booth industry
### ガールズトレンドビジネス
ガールズトレンドビジネス
Means:
Girls’ Trend Business.
Pronounced:
Gāruzutorendobijinesu.
It can be broken down into:
#### ガールズ
ガールズ
Gāruzu
English: Girls.
#### トレンド
トレンド
torendo
English: Trend.
#### ビジネス
ビジネス
bijinesu
English: Business.
### プリ
プリ
Puri
English: Print.
## Official websites
-
-
-
Korea provides the comparison for Japan’s trajectory. The same industry’s journey in Korea, from arcade sticker photos in 1995 to its leading company’s equity turning negative in 2026, is covered in [Thirty Years of Photo Booths in Korea](/p/9638).
## References
Sources: The Chinese original was first published on 2022-09-03 and last updated on 2026-09-24. Data and observations retain the historical dates and markets stated in the article.